
- Title
-
R-Spondin1 enhances wnt signaling and decreases weight loss in short bowel syndrome zebrafish
- Authors
- Maselli, K.M., Levin, G., Gee, K.M., Leeflang, E.J., Carreira, A.C.O., Sogayar, M.C., Grikscheit, T.C.
- Source
- Full text @ Biochem Biophys Rep

Fig. 1. Repeated intraperitoneal injections did not affect weight loss or intestinal adaptation. One-week dosing schedule for rhRSPO1 or vehicle control(A). Post-operative weights(B). Hematoxylin and eosin staining of proximal intestinal segments at 7 days from Sham + PBS(C), SBS + PBS(D), Sham + RSPO1(E), and SBS + RSPO1(F). Measurements of VH(G) and VEP(H). Scale bars 100 μm *p < 0.05, **p < 0.01, ***p < 0.001. |
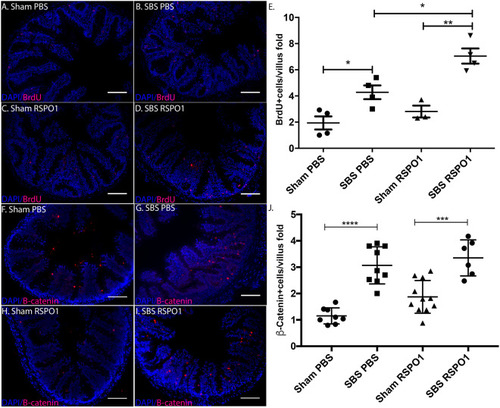
Fig. 2. Intestinal epithelial cell proliferation is increased with rhRSPO1 at 7 days. Immunofluorescent staining of proximal intestinal segments for bromodeoxyuridine (BrdU) for Sham + PBS(A), SBS + PBS(B), Sham + RSPO1(C), and SBS + RSPO1 fish(D) at POD7. Quantification of BrdU + cells/villus fold(E). Immunofluorescent staining of proximal intestinal segments for β-catenin for Sham + PBS(F), SBS + PBS(G), Sham + RSPO1(H), and SBS + RSPO1 fish(I) at POD7. Quantification of β-catenin + cells/villus fold(J). Scale bars 100 μm ***p < 0.001. |

Fig. 3. Two-week dosing schedule for rhRSPO1 or vehicle control(A). Post-operative weights(B). Hematoxylin and eosin staining of proximal intestinal segments at 14 days from Sham + PBS(C), SBS + PBS(D), Sham + RSPO1(E), and SBS + RSPO1(F). Measurements of VH(G) and VEP(H). Scale bars 100 μm *p < 0.05, ***p < 0.001. |

Fig. 4. Intestinal β-catenin is increased with rhRSPO1 at 14 days. Immunofluorescent staining of proximal intestinal segments for bromodeoxyuridine (BrdU) for Sham + PBS(A), SBS + PBS(B), Sham + RSPO1(C), and SBS + RSPO1(D) fish at POD14. Quantification of BrdU + cells/villus fold(E). Immunofluorescent staining of proximal intestinal segments for β-catenin for Sham + PBS(F), SBS + PBS(G), Sham + RSPO1(H), and SBS + RSPO1 fish(I) at POD14. Quantification of β-catenin + cells/villus fold(J). Scale bars 100 μm *p < 0.05, **p < 0.01. |
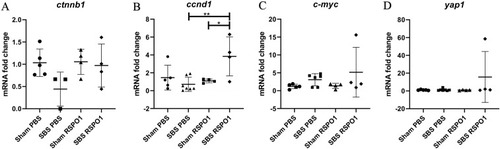
Fig. 5. Intestinal ccnd1 gene expression is increased with rhRSPO1 at 14 days. RT-qPCR of proximal intestine messenger RNA for ctnnb1(A), ccnd1(B), c-myc(C) and yap1(D). *p < 0.05, **p < 0.005. |