FIGURE SUMMARY
Title

Stress reactivity elicits a tissue-specific reduction in telomere length in aging zebrafish (Danio rerio)

Authors
Evans, J.R., Torres-Pérez, J.V., Miletto Petrazzini, M.E., Riley, R., Brennan, C.H.
Source
Full text @ Sci. Rep.

Zebrafish selected for molecular analysis based on behaviourally determined stress reactivity. (a) Diagram of the novel tank assay: each fish is individually transferred from its home tank to a novel test tank. The time (seconds) spent in the bottom in each minute was used for analysis. (b) Entire population results for bottom dwelling by minute over the course of the novel tank test. (c) Population distribution of young (6–9 month) and aging (18 month) males and females based on their bottom dwelling in minute two (N = 256). (d) Bottom dwelling differences in minute two for the fish selected for molecular analysis (N = 64). Note that (d) corresponds to either extreme of the population distribution in (c). Error bars in (b) represent ± standard error mean (SEM). For (c) and (d) middle lines indicate median values and error bars represent interquartile range. YFL young female low stress reactivity, YFH young female high stress reactivity, YML young male low stress reactivity, YMH young male high stress reactivity, AFL aging female low stress reactivity, AFH aging female high stress reactivity, AML aging male low stress reactivity, AMH aging male high stress reactivity. ***p-value < 0.001.

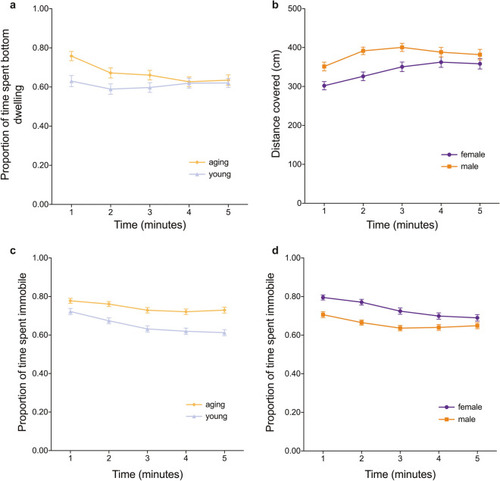
Results of the novel tank diving test. (a) Overall proportion of time spent in the bottom third of the tank over the duration of the test. (b) Distance covered by males and females for each minute of the novel tank test. (c) Proportion of time aging and young, and (d) males and females spent in an immobile state over the 5 min of the test. All error bars represent ± standard error mean (SEM).

Analysis of HPI axis-associated gene expression within brain extracts by qPCR validates behaviourally determined stress reactivity. qPCR analysis of the HPI axis-associated genes, corticotropin-releasing factor (crf), glucocorticoid receptor α (grα) and mineralocorticoid receptor (mr) in association with zebrafish (a) sex and (b) stress reactivity (N = 96). (c) Stress reactivity had a significant effect on the MR:GR ratio, a key indicator of HPA axis dysfunction (N = 32). The expression of SMAD Specific E3 Ubiquitin Protein Ligase (smurf2) was also analysed through qPCR and was significantly associated with both (d) sex and (e) stress reactivity (N = 32). Box plots indicate median values (middle lines), first and third quartiles (box edges) and minimum and maximum values (whiskers). *p-value < 0.05; **p-value < 0.01.

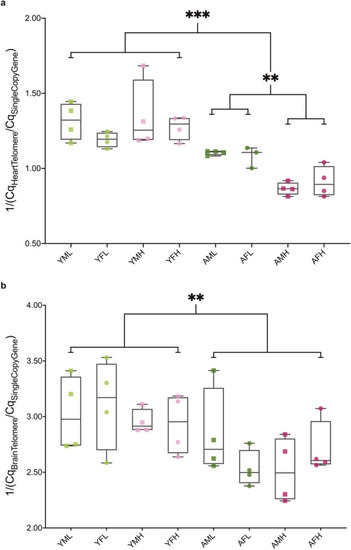
Telomere length shortens with age in both heart and brain and correlates with stress reactivity in the heart, but not brain, of zebrafish. (a) Relative telomere length ratios calculated by qPCR for heart tissue grouped by age, sex and stress reactivity (N = 31). Age and stress reactivity in aging zebrafish have a signficant effect on telomere length in heart tissue. (b) Relative telomere length ratios for brain grouped by age, sex and stress reactivity (N = 32). Only age has a significant effect. Box plots indicate median values (middle lines), first and third quartiles (box edges) and minimum and maximum values (whiskers). YFL young female low stress reactivity, YFH young female high stress reactivity, YML young male low stress reactivity, YMH young male high stress reactivity, AFL aging female low stress reactivity, AFH aging female high stress reactivity, AML aging male low stress reactivity, AMH aging male high stress reactivity. **p-value < 0.01; ***p-value < 0.001.

Acknowledgments
This image is the copyrighted work of the attributed author or publisher, and ZFIN has permission only to display this image to its users. Additional permissions should be obtained from the applicable author or publisher of the image. Full text @ Sci. Rep.