FIGURE SUMMARY
Title

The Genome-Wide Impact of Nipblb Loss-of-Function on Zebrafish Gene Expression

Authors
Spreafico, M., Mangano, E., Mazzola, M., Consolandi, C., Bordoni, R., Battaglia, C., Bicciato, S., Marozzi, A., Pistocchi, A.
Source
Full text @ Int. J. Mol. Sci.

(A) Sample correlation matrix using gene-wise standardized expression values of 1922 highly variable genes. (B) Unsupervised hierarchical clustering of ctrl-MO and nipblb-MO-injected embryos at 24 hpf based on the standardized gene expression values of 1922 highly variable genes. Each column represents one separated biological sample.

(A) Sample correlation matrix using gene-wise standardized expression values of 1922 highly variable genes. (B) Unsupervised hierarchical clustering of ctrl-MO and nipblb-MO-injected embryos at 24 hpf based on the standardized gene expression values of 1922 highly variable genes. Each column represents one separated biological sample.

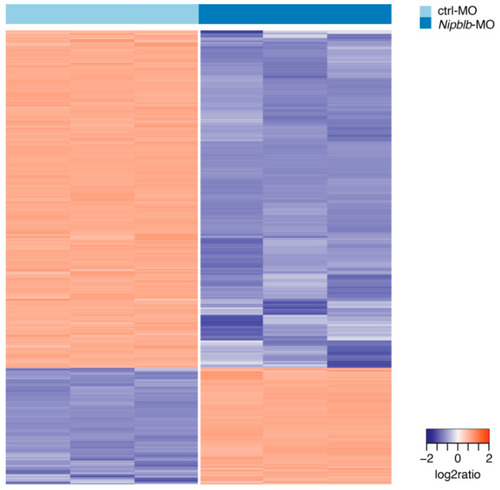
Hierarchical clustering of ctrl-MO and nipblb-MO-injected embryos based on the standardized gene expression values of 5338 genes differentially expressed in the comparison between nipblb-MO and ctrl-MO embryos at 24 hpf. Each column represents one separated biological sample.

(A) Dot plot of the KEGG gene sets significantly enriched in the 3972 down-regulated (left) and in the 1366 up-regulated (right) genes by nipblb loss-of-function at 24 hpf. Dot color indicates statistical significance of the enrichment (false discovery rate FDR); dot size represents the fraction of genes annotated to each term. Gene sets are ranked in decreasing order based on the FDR value. (B) Average expression of KEGG Wnt canonical pathway genes in sample subgroups (**** p ≤ 0.0001 in unpaired t-test).

(A) Dot plot of the top 15 significantly enriched (normalized enrichment score NES > 0 and FDR ≤ 0.05) and depleted (normalized enrichment score NES < 0 and FDR ≤ 0.05) gene sets from Gene Set Enrichment Analysis of nipblb-MO at 24 hpf as compared to their ctrl-MO counterpart. Dot color indicates statistical significance of the enrichment (false discovery rate FDR), dot size represents the fraction of genes annotated to each term. Gene sets are ranked in decreasing order based on the NES value. (B) Dot plot of the significantly enriched (normalized enrichment score NES > 0 and FDR ≤ 0.05) and depleted (normalized enrichment score NES < 0 and FDR ≤ 0.05) myeloid differentiation and AML-related gene sets from Gene Set Enrichment Analysis of nipblb-MO at 24 hpf as compared to their ctrl-MO counterpart. (C) Average expression in NMP1 mutant and wild-type AMLs of 3972 genes down-regulated by nipblb loss-of-function at 24 hpf (* p = 0.016 in unpaired t-test).

Acknowledgments
This image is the copyrighted work of the attributed author or publisher, and ZFIN has permission only to display this image to its users. Additional permissions should be obtained from the applicable author or publisher of the image. Full text @ Int. J. Mol. Sci.