
- Title
-
Assessing the toxicity of three "inert" herbicide safeners toward Danio rerio: Effects on embryos development
- Authors
- Liu, S., Deng, X., Zhou, X., Bai, L.
- Source
- Full text @ Ecotoxicol. Environ. Saf.
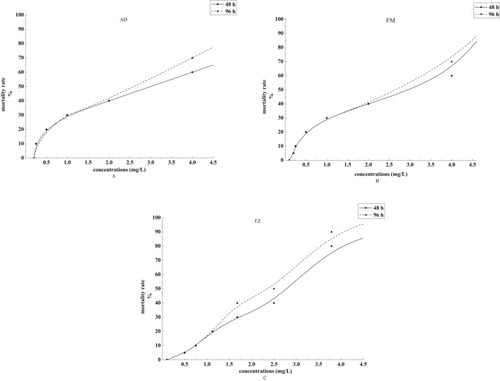
Fig. 1. Mortality rates of zebrafish embryos exposed to different concentrations of AD, FM, and FZ for 48 h and 96 h. A: mortality rate curve for AD concentrations; B: mortality rate curve for FM concentrations; C: mortality rate curve for FZ concentrations. |

Fig. 2. Images of zebrafish embryos after 96 h of exposure. A, Morphological changes; B, Images of apoptosis in AO-stained. CK: control check; AD-0.02: 0.02 mg/L AD; AD-0.2: 0.2 mg/L AD; FM-0.01: 0.01 mg/L FM; FM-0.1: 0.1 mg/L FM; FZ-0.02: 0.02 mg/L FZ; FZ-0.2: 0.2 mg/L FZ. |
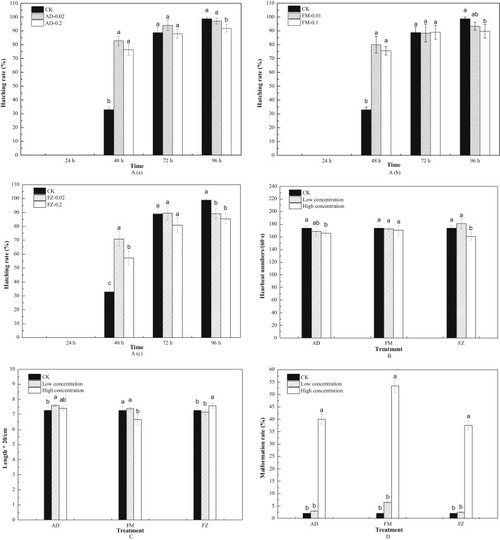
Fig. 3. Effects of herbicide safeners on the hatching rate (A), heartbeat numbers (60 s, B), length (C), and malformation rates (D) of zebrafish. Treatment groups: CK: control check; AD-0.02: 0.02 mg/L AD; AD-0.2: 0.2 mg/L AD; FM-0.01: 0.01 mg/L FM; FM-0.1: 0.1 mg/L FM; FZ-0.02: 0.02 mg/L FZ; FZ-0.2: 0.2 mg/L FZ; Low concentration: 0.02 mg/L AD, 0.01 mg/L FM, or 0.02 mg/L FZ; High concentration: 0.2 mg/L AD, 0.1 mg/L FM, or 0.2 mg/L FZ. Values with the same letter (a, b, and c) are not significantly different, and values followed by different letters denote a significant difference among the control and various treatments (p < 0.05). |

Fig. 4. Enzyme activities related to oxidative stress in embryos after 96 h exposure to safeners. Low concentration: 0.02 mg/L AD, 0.01 mg/L FM, or 0.02 mg/L FZ; High concentration: 0.2 mg/L AD, 0.1 mg/L FM, or 0.2 mg/L FZ. Values with the same letter (a, b, and c) are not significantly different, and values followed by different letters denote a significant difference among the control and various treatments (p < 0.05). |
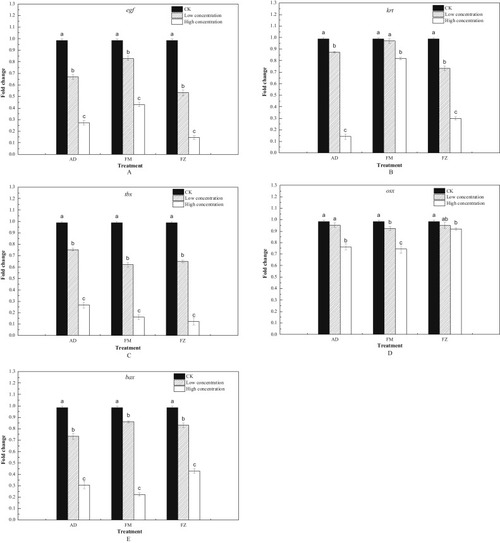
Fig. 5. mRNA levels of genes related to malformation and cell apoptosis in embryos after exposure to the tested safeners. Gene fold changes of egf, krt 17, tbx 16, bcl 2, and bax in zebrafish embryos exposed to herbicide safeners for 96 h. A, egf; B, krt 17; C, tbx 16; D, bcl 2; E, bax. CK: control group; Low concentrations: 0.02 mg/L AD, 0.01 mg/L FM, or 0.02 mg/L FZ; High concentrations: 0.2 mg/L AD, 0.1 mg/L FM, or 0.2 mg/L FZ. Values with the same letter (a, b, and c) are not significantly different, and values followed by different letters denote a significant difference among the control and various treatments (p < 0.05). |