
Image
|
Figure Caption
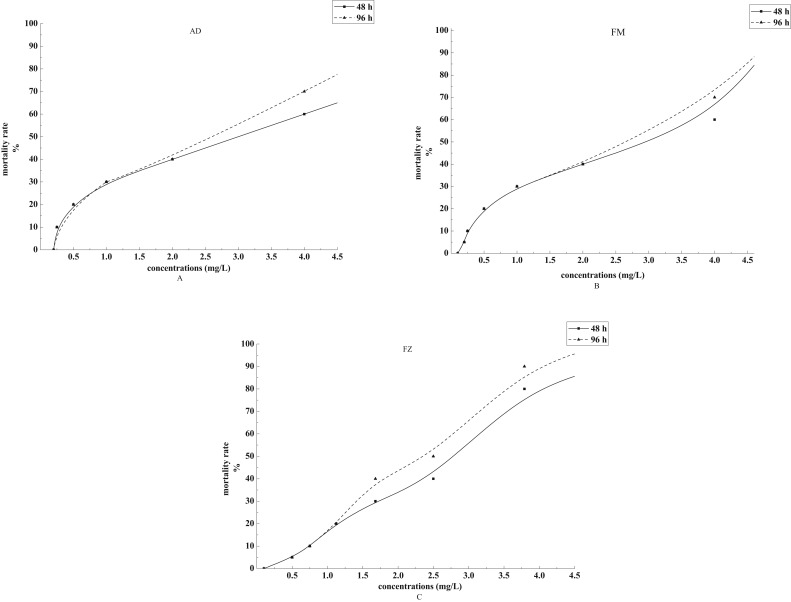
Fig. 1 Fig. 1. Mortality rates of zebrafish embryos exposed to different concentrations of AD, FM, and FZ for 48 h and 96 h. A: mortality rate curve for AD concentrations; B: mortality rate curve for FM concentrations; C: mortality rate curve for FZ concentrations.
Acknowledgments
This image is the copyrighted work of the attributed author or publisher, and
ZFIN has permission only to display this image to its users.
Additional permissions should be obtained from the applicable author or publisher of the image.
Full text @ Ecotoxicol. Environ. Saf.