FIGURE SUMMARY
Title

An isoflavone derivative potently inhibits the angiogenesis and progression of triple-negative breast cancer by targeting the MTA2/SerRS/VEGFA pathway

Authors
Zhang, X., Zou, G., Li, X., Wang, L., Xie, T., Zhao, J., Wang, L., Jiao, S., Xiang, R., Ye, H., Shi, Y.
Source
Full text @

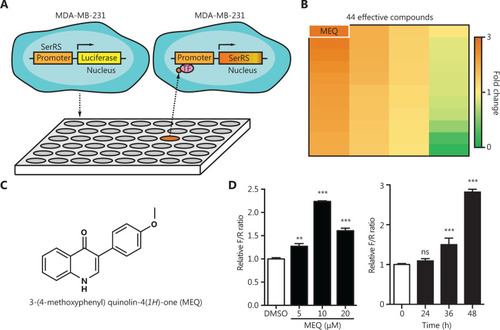
High throughput screening for compounds that act on the SerRS promoter. (A) Scheme of the dual luciferase reporter-based high throughput screening. (B) Heat map of the luciferase/Renilla ratios for 44 compounds responsive to the SerRS promoter. (C) The molecular structure of MEQ. (D) Relative firefly/Renilla (F/R) ratios for MEQ at indicated dosages and time points. Data are plotted as means ± SEM (n = 3; ns, not significant; **P < 0.01; ***P < 0.001 using Student’s t-test.

MEQ inhibits VEGFA expression by upregulating SerRS in cultured cells. (A, B) The qRT-PCR shows SerRS expression in MDA-MB-231 cells treated with MEQ at indicated dosages or with dimethyl sulfoxide (DMSO) as a vehicle control for 48 h (A) or treated with 10 μM MEQ for the indicated time periods (B). (C) Western blotting to show SerRS protein levels in MDA-MB-231 cells treated with the indicated dosages of MEQ or DMSO for 48 h. (D) The qRT-PCR shows SerRS expression in human umbilical vein endothelial cells (HUVECs) cells treated with 10 μM of MEQ for 48 h. (E, F) The qRT-PCR shows vascular endothelial growth factor A (VEGFA) expression in MDA-MB-231 cells treated with MEQ for the indicated time periods (E) and in HUVEC cells treated with 10 μM of MEQ for 48 h (F). (G) ELISA analyses of secreted VEGFA from MDA-MB-231 cells treated with 10 μM MEQ for 48 h. (H) Western blotting shows the knockdown efficiency of shRNA against SerRS (shSerRS) with a shRNA against lacZ gene (shLacZ) as a negative control. (I) The qRT-PCR shows VEGFA expression in shSerRS or shLacZ transfected MDA-MB-231 cells treated with 10 μM MEQ for 48 h. All bar graphs are plotted as the mean ± SEM (n = 3; ns, not significant; *P < 0.05; **P < 0.01; ***P < 0.001 using Student’s t-test.

MEQ inhibits angiogenesis in vivo. (A, B) The embryos of transgenic zebrafish (Tg [Fli1a: EGFP]) at 1-2 cell stage were injected with MEQ and vascular development was monitored at 72 h post-fertilization (A) and the percentage of fish with deficiency in intersegmental vessels (Hypo-ISV) were analyzed (B). ***P < 0.001 using the χ2-test. (C) The qRT-PCR results show the expression of Sars (i.e., fish SerRS) and Vegfa in the zebrafish treated with MEQ or dimethyl sulfoxide (DMSO). Data are plotted as the mean ± SEM (n = 3; *P < 0.05; ***P < 0.001 using Student’s t-test). (D) Western blotting shows SerRS protein levels induced by MEQ in 4T1 cells. (E) Representative images of Matrigel plugs formed by 4T1 cells treated with MEQ or DMSO control. Scale bar represents 1 cm. (F–H) Immunofluorescence of CD31(F), immunochemical staining of SerRS (G) and VEGFA (H) in the Matrigel plugs and the quantification of positively-stained cells are plotted as the mean ± SEM (n = 5; *P < 0.05; ***P < 0.001 using Student’s t-test. Scale bars represent 100 μm.

MEQ suppressed the progression of breast cancer allografts in mice. (A) Scheme of mouse experiments based on the breast cancer allograft model. qod: quaque omni die. (B) Tumor growth curve. (n = 5, **P < 0.01 using the Student’s t-test.). (C) Tumor weights at 30 days post-inoculation. (n = 5, **P < 0.01; ***P < 0.001 using Student’s t-test). (D) Kaplan-Meier survival curves of tumor-bearing Balb/c mice treated with MEQ (100 mg/kg) or dimethyl sulfoxide control (n = 8, *P < 0.05 using the log-rank test). (E, F) Western blotting to show SerRS protein levels in tumor tissues (E) and the densitometry quantification. (F) Data are plotted as the mean ± SEM (n = 4; **P < 0.01; ***P < 0.001 using Student’s t-test). (G) Immunohistochemical staining of SerRS in tumor tissue and its quantification (n = 5; ***P < 0.001 using Student’s t-test). (H) The qRT-PCR shows VEGFA mRNA levels of tumor tissues. (I, J) Immunohistochemical staining of VEGFA (I) and CD31 (J) in tumor tissues and quantification of positive cell numbers plotted as the mean ± SEM (n = 5; **P < 0.01; ***P < 0.001 using Student’s t-test). All scale bars represent 100 μm.

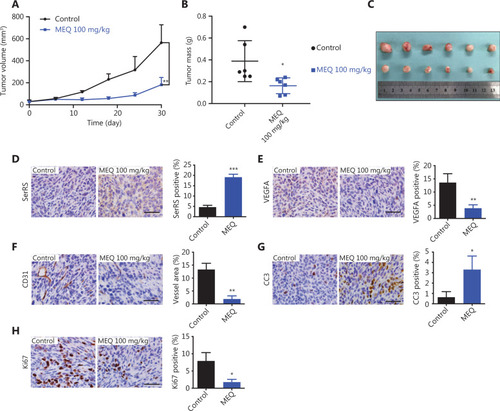
MEQ inhibits the growth of human triple-negative breast cancer (TNBC) xenografts in mice. (A) The growth curves of MDA-MB-231 xenografts in mice treated with MEQ or the dimethyl sulfoxide control. Data are plotted as the mean ± SD. (B, C) At 30 days post-inoculation, the xenografts were dissected and weighted, n = 5. D-H Immunohistochemical staining for SerRS (D), VEGFA (E), CD31 (F), CC3 (G), and Ki67 (H) in the xenografts; n = 5. All scale bars represent 100 μm and all bar graphs are plotted as the mean ± SEM (ns, not significant; *P < 0.05; **P < 0.01; ***P < 0.001 using Student’s t-test).

MEQ targets MTA2 to regulate SerRS expression. (A) Dual-luciferase reporter assay for biotin-conjugated MEQ (MEQ-biotin). Values are the mean ± SEM. ns, not significant, ***P < 0.001 using analysis of variance. (B) Western blots show that MEQ-biotin is as active as MEQ in regulating SerRS expression. (C) MEQ-interacting proteins were pulled down from the MDA-MB-231 cell lysate with streptavidin beads and analyzed by SDS-PAGE and silver staining. The black arrow indicates protein bands that may specifically interact with MEQ. (D) Western blotting to confirm that MTA2 was co-purified with MEQ-biotin. (E) Western blotting to show the knockdown efficiency of shRNA against MTA2 (shMTA2) in MDA-MB-231 cells. (F) Western blotting to show the protein levels of MEQ required to induce SerRS expression in MTA2-silenced (shMTA2) or control (shLacZ) MDA-MB-231 cells.

Mechanistic model to show how MEQ inhibits triple-negative breast cancer (TNBC) angiogenesis by regulating the MTA2/SerRS/VEGFA axis. The MTA2-containing NuRD deacetylase complex binds to the SerRS promoter to suppress its transcription, which allows more SerRS competitor, i.e., c-Myc proteins, to bind to the VEGFA promoter and activate VEGFA expression and tumor angiogenesis. MEQ interacts with MTA2 and may cause the release of the NuRD complex from the SerRS promoter, resulting in elevated expression of SerRS, which competes off the c-Myc and binds to the VEGFA promoter to suppress its transcription and inhibit tumor angiogenesis.

Acknowledgments
This image is the copyrighted work of the attributed author or publisher, and ZFIN has permission only to display this image to its users. Additional permissions should be obtained from the applicable author or publisher of the image. Full text @