
- Title
-
Localised Collagen2a1 secretion supports lymphatic endothelial cell migration in the zebrafish embryo
- Authors
- Chaudhury, S., Okuda, K.S., Koltowska, K., Lagendijk, A.K., Paterson, S., Baillie, G.J., Simons, C., Smith, K.A., Hogan, B.M., Bower, N.I.
- Source
- Full text @ Development

mbtps1uq28bh and sec23auq22bh embryos fail to form a lymphatic network in the trunk. (A-D) Confocal images of Tg(fli1a:nEGFP); Tg(-5.2lyve1b:dsRed) (green/magenta) sibling (A,C), mbtps1uq28bh (B) and sec23auq22bh (D) embryos at 5 dpf showing mbtps1uq28bh and sec23auq22bh lack TD, DLLV and ISLVs at 5 dpf. Absence indicated by asterisks. All embryos show normal development of DA, PCV and vISV at 5 dpf. (E,F) Quantification reveals fewer LECs within vessels in mbtps1uq28bh (E) and sec23auq22bh (F) when compared with siblings. Measured across five somites (E) and eight somites (F). (G,H) At 54 hpf, there are fewer PLs at the HM in mbtps1uq28bh (G) and sec23auq22bh (H) mutants when compared with siblings (measured across five somites). (I) At 3 dpf, there are no significant differences in the number of PLs at the HM of sec23auq22bh mutants when compared with siblings (measured across five somites). (J,K) At 5 dpf there are significantly more PLs at the HM in mbtps1uq28bh (J) and sec23auq22bh (K) mutants when compared with siblings (measured across five somites). (L,M) Time-lapse imaging of Tg(fli1a:nEGFP); Tg(-5.2lyve1b:dsRed) showing PLs migrate from the HM in siblings (representative of n=7 embryos analysed) when compared with sec23auq22bh mutants (representative of n=4 embryos analysed). Yellow arrow indicates migrating PL (L) and stalled PL (M). (N) Cross-section showing PLs migrate adjacent to notochord. (O) There were significantly fewer PLs migrating in sec23auq22bh mutants (n=4) when compared with siblings (n=7). ns, not significant. *P<0.05, ***P<0.001, ****P<0.0001 (two-tailed unpaired Student's t-test). DA, dorsal aorta; DLLV, dorsal longitudinal lymphatic vessel; ISLVs, intersegmental lymphatic vessels; N, notochord; PCV, posterior cardinal vein; PL, parachordal LEC; TD, thoracic duct; vISV, venous intersegmental vessel. Scale bars: 50 µm in A-D,L,M; 80 µm in N. |
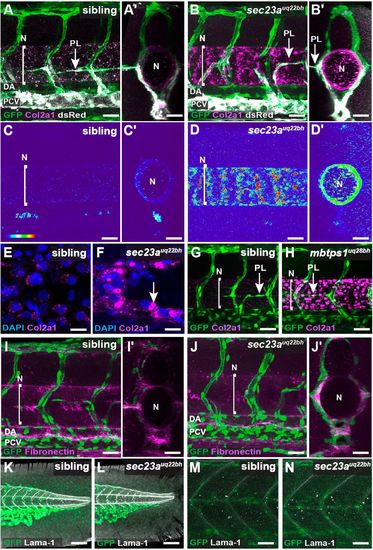
sec23auq22bh and mbtps1uq28bh mutant embryos display failed secretion of Collagen2a1. (A-D′) IF staining of Col2a1 and eGFP in 2 dpf Tg(fli1a:nEGFP); Tg(-5.2lyve1b:dsRed) siblings (A, cross-section A′) and sec23auq22bh mutants (B, cross-section B′) showing vasculature, secondary sprouts and Col2a1 labelled green, grey and magenta, respectively. Thermal maps showing lateral and cross sectional images reveal that sec23auq22bh embryos (n=10) exhibit an accumulation of Col2a1 around the notochord when compared with siblings (n=22) at 2 dpf (C-D′). (E,F) High magnification confocal images show intracellular accumulation of Col2a1 (indicated by white arrow) in NSCs in sec23auq22bh (F) when compared with siblings (E). (G,H) Confocal images as in A of siblings (G, n=12) and mbtps1uq28bh (H, n=6) mutants show similar accumulation of Col2a1 at 2 dpf as sec23auq22bh. (I-J′) Confocal images as in A showing vasculature and secondary sprouts (green) and Fibronectin (magenta) indicate no obvious defect in secretion of Fibronectin in siblings (I, cross-section I′; n=36) and sec23auq22bh embryos (J, cross-section J′; n=8). (K-N) Confocal images as in A showing vasculature (green) and Laminin (Lama1; grey) indicate no obvious defect in secretion of Laminin in the fin (K,L) or somite (M,N) when siblings (n=36) were compared with sec23auq22bh mutants (n=7). Line marked N indicates notochord. DA, dorsal aorta; N, notochord; PCV, posterior cardinal vein. Scale bars: 100 µm in A-F; 80 µm in G-N. |

col2a1auq36bh mutants exhibit increased PL numbers in the HM over time and reduced numbers of LECs in mature vessels. (A,B) Confocal images of Tg(fli1a:nEGFP); Tg(-5.2lyve1b:dsRed) sibling (A, n=16) and col2a1a1uq36bh (B, n=9) at 54 hpf showing PLs migrate to the HM. (C-F) Confocal images of Tg(fli1a:nEGFP); Tg(-5.2lyve1b:DsRed) sibling (C, n=4; E, n=7) and col2a1auq36bh (D, n=5; F, n=7;) embryos at 3 dpf (C,D) and 4 dpf (E,F) show that PLs fail to migrate from the HM in col2a1auq36bh mutants compared with the siblings. (G,H) Confocal images of sibling (G, n=32) and col2a1auq36bh (H, n=23) embryos at 5 dpf showing stalled PLs at the HM in col2a1auq36bh mutants. Arrowheads indicate vessel fragments. (I,J) IF assay of Col2a1 and eGFP in Tg(fli1a:nEGFP); Tg(-5.2lyve1b:dsRed) siblings (I, thermal map I′, n=24) and col2a1auq36bh (J, thermal map J′, n=8) mutants confirm loss of Col2a1a in col2a1auq36bh. (K,L) No difference in PL number was observed in col2a1auq36bh and siblings at 54 hpf (K); however, at 5 dpf there was a significant increase in stalled PLs at the HM in col2a1auq36bh mutants when compared with siblings (L). (M) Quantification of nuclei in the TD and ISLV revealed a significant reduction in col2a1auq36bh (n=23) when compared with siblings (n=32). Line marked N indicates notochord. ns, not significant. *P<0.05, ***P<0.001 (two-tailed unpaired Student's t-test). TD, thoracic duct; HM, horizontal myoseptum; ISLVs, intersegmental lymphatic vessels; N, notochord; PL, parachordal LEC. Scale bars: 50 µm in A-H; 80 µm in I,J. |

Abnormal migratory dynamics of PLs underpins an absence of lymphatic vessels in col2a1auq36bh mutant embryos. (A) Quantification of migration distance along the anterior-posterior (a-p) axis for mutant and sibling PLs (n=6 embryos). (B) Quantification of the anterior-posterior (a-p) axis PL migration velocity over 20 min in sibling and mutant embryos (n=6 embryos). (C) Quantification of the sphericity of PL nuclei in µm2 at 3 dpf and 4 dpf in col2a1auq36bh mutants compared with siblings. (D) Quantification of the dorso-ventral axis migration for sibling and mutant PLs (n=6 embryos). (E,F) Time-lapse imaging from 60 to 80 hpf of Tg(fli1a:nEGFP); Tg(-5.2lyve1b:dsRed) showing a PL migrating from the HM in siblings (n=6) compared with col2a1auq36bh mutants (n=6). The nuclei of a migrating (E) and stalled (F) PL are rendered blue (and indicated by blue arrow). (G,H) Quantification of dorso-ventral migration showing individual cell tracks (G) and mean±s.d. (H) for sibling and col2a1auq36bh PLs. (I-L) Confocal images of Tg(-5.2lyve1b:dsRed) (magenta) in uninjected siblings (I, n=20) compared with sec23auq22bh mutants (white asterisks, J, n=29) and embryos injected with pDest:Col2a1:sec23a-p2a-EGFP (green) (K,L). sec23auq22bh mutants displayed a partial rescue of TD development (white arrows) (L, n=21). Injected siblings (K, n=14) and sec23auq22bh mutants showed formation of ectopic vessels (yellow arrows). (M) Quantification of ectopic fragment formation in injected embryos compared with uninjected controls for both sibling and sec23auq22bh mutants. (N) Quantification of TD formation in sec23auq22bh mutants injected with col2a1a-Sec23a-T2A-eGFP. In siblings, the formation of ectopic fragments leads to reduced TD formation. (O,P) Schematic showing a model for Col2a1 secretion from NSCs into the ECM around the migrating PLs (O). Defects in Col2a1 secretion from NSCs leads to failed migration of PLs (P). ns, not significant. *P<0.05, ***P<0.001, ****P<0.0001 (two-tailed unpaired Student's t-test). HM, horizontal myoseptum; M, myotome; N, notochord; NT, neural tube; PL, parachordal LEC. PHENOTYPE:
|