
- Title
-
The identification of dual protective agents against cisplatin-induced oto-and nephrotoxicity using the zebrafish model
- Authors
- Wertman, J.N., Melong, N., Stoyek, M.R., Piccolo, O., Langley, S., Orr, B., Steele, S.L., Razaghi, B., Berman, J.N.
- Source
- Full text @ Elife
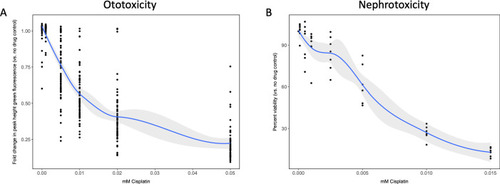
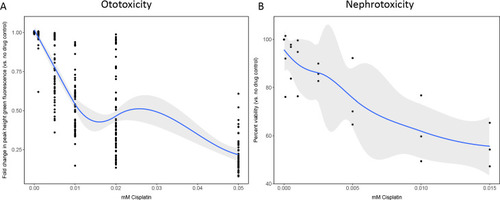
(A) Groups of approximately 50 casper zebrafish larvae were treated with increasing doses of cisplatin, by addition to the E3 media surrounding the larvae, at 72 hr post-fertilization (hpf). The following day, larval neuromasts were stained with 2 µM YO-PRO1, then were subjected to Biosorter-mediated fluorescence profiling. Peak Height (PH) of green fluorescence is displayed, relative to untreated controls. Each data point represents an individual larva. Dose–response relationship is represented by the blue line, which was calculated with a four-parameter log-logistic model, as described in a relevant study (Ritz et al., 2015). Modeling was done in R with a drc extension package. Grey-shaded area represents the 95% confidence interval (CI) of this line. (B) HK-2 human proximal tubule cells were treated with increasing concentrations of cisplatin for 48 hr. Cells were rinsed, then an alamarBlue assay was performed as per the manufacturer’s instructions. Data are represented as % viability, in comparison with untreated cells. N = 4, an average of at least two wells was measured per replicate. Dose–response analysis performed as in A). |
( |

( |

( |
|
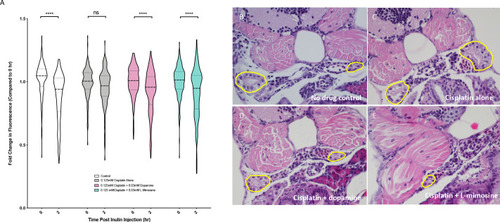
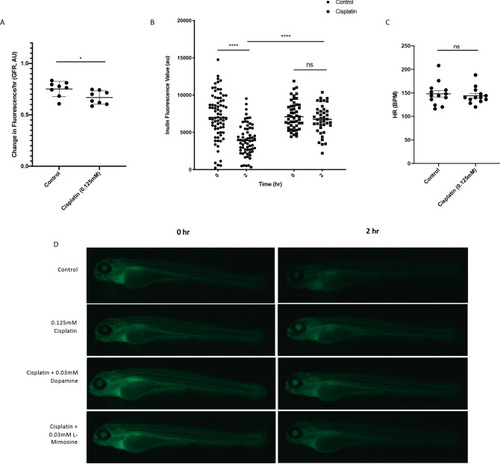
(A) Casper zebrafish larvae were treated at 60 hr post-fertilization (hpf) with either vehicle control or the indicated protective agents. At 72 hpf, larvae were rinsed then treated with either vehicle control or 0.125 mM cisplatin for 24 hr. Larvae were then injected via the common cardinal vein with FITC-inulin, then measured for fluorescence swiftly with the Biosorter. Larvae were rinsed then measured 2 hr later. Fold change in overall larval fluorescence is represented in relation to 0 hr. ****=p<0.001, as per two-way ANOVA with a Tukey post-test. Three replicates, with 50 larvae/treatment group/time point minimum. Representative images of larvae can be found in Figure 5—figure supplement 1d. Larvae were treated as in (A) and were fixed at either 24 hr post-treatment (B–E) or at 72hpt (Figure 5—figure supplement 2a-d). Larvae were pre-embedded in low melting point agarose, then in paraffin, then sectioned and stained with H and E. (B) Control, (C) Cisplatin only, (D) Cisplatin + 0.03 mM dopamine, (E) Cisplatin + 0.03 mM L-mimosine. No significant differences were observed in the proximal tubular histology. |
|

|
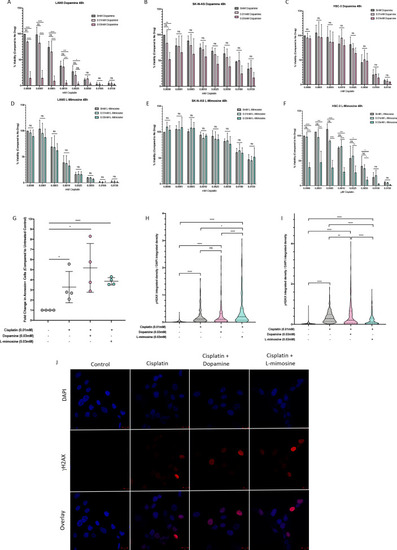
NBL and oral squamous cell carcinoma cell lines were pretreated for 12 hr with vehicle control, or either dopamine or L-mimosine at either 0.01 mM or 0.03 mM. Cells were then treated with increasing concentrations of cisplatin and incubated for either 24 hr (Figure 6—figure supplement 1a-f) or 48 hr (data shown here). (A–F) An alamarBlue assay was used to determine cell viability. Results are displayed as % compared to untreated control. (A and D) LAN5, (B and E) SK-N-AS, (C and F) HSC-3. *=p<0.05, **=p<0.01, ***=p<0.005, and ****=p<0.001, as per two-way ANOVA with a Tukey post-test. N=3. (G) SK-N-AS cells were treated the same as in A-F, with the concentrations of protective agent specified. 48 hr following cisplatin treatment, cells were prepared for PE-conjugated Annexin V/SYTOXBlue-based flow cytometry. Graph of fold change in Annexin+ cells (gated to biological control) is displayed, relative to vehicle control. *=p<0.05, ****=p<0.001, as per two-tailed student’s t-tests comparing treatment groups to control. N=4. Representative flow plots and gating strategies can be found in Figure 6—figure supplement 2a-i H–J) Cancer cells were treated as in A-G, with the concentrations of protective agents specified. Twenty four hours following cisplatin treatment, cells were fixed, permeabilized and labeled with anti-phospho-histone H2A.X (Ser139) and DAPI to label γH2AX positive foci and nuclear material, respectively. (H and I) Quantification of γH2AX staining, reported as γH2AX integrated density/DAPI integrated density, with each data point corresponding to an individual nucleus. *=p<0.05, **=p<0.01, ****=p<0.001, as per Kruskal-Wallis testing with a Dunn’s multiple comparison test. N=3. (H) SK-N-AS cells, (I) LAN5 cells. (J) Representative confocal microscopy of SK-N-AS cells with indicated treatments, displaying DAPI, gamma H2AX, and an overlay. |
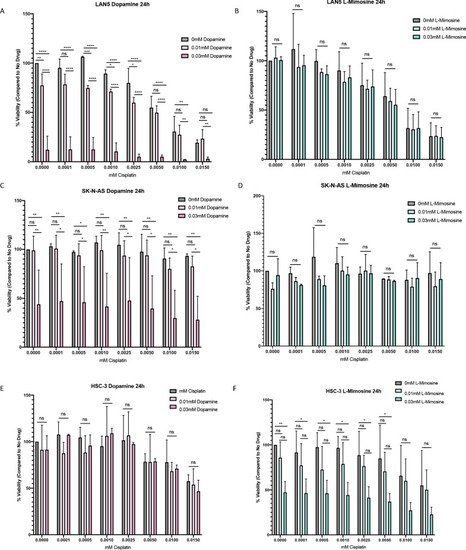
Neuroblastoma (NBL) and oral squamous cell carcinoma cell lines were pretreated for 12 hr vehicle control, or either dopamine or L-mimosine at either 0.01 mM or 0.03 mM. Cells were then treated with increasing concentrations of cisplatin and incubated for 24 hr (48 hr data shown in |
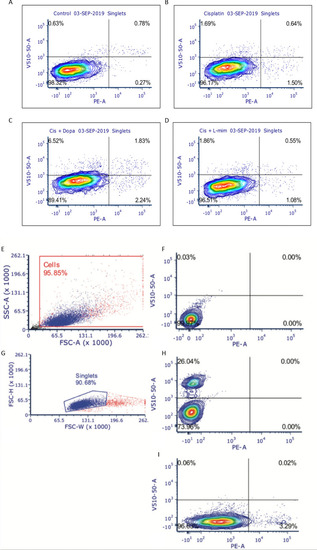
SK-N-AS neuroblastoma (NBL) cells were treated with either vehicle control or either 0.03 mM dopamine or 0.03 mM L-mimosine for 12 hr, were rinsed, then treated with 0.01 mM cisplatin for 48 hrs. Cells were collected, rinsed, and prepared for PE-conjugated Annexin-V/SYTOXBlue flow cytometry. Data were analyzed using BD FACSDiva Software. ( |