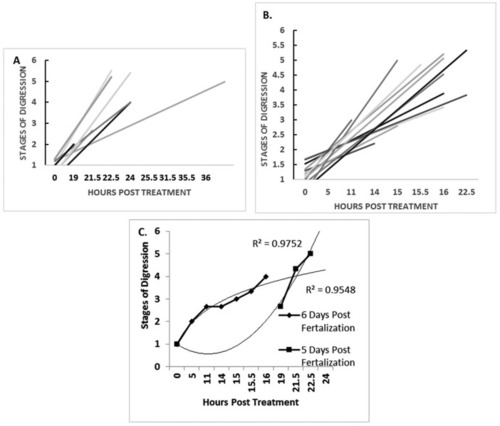
Graphs comparing the stages of digression (see <xref rid='neurosci-06-01-025-t01' ref-type='table'>Table 1</xref>) in 5 and 6 dpf fish in response to 6-OHDA treatment. A–B: A demonstration of the trend lines of linear relationships between stages of digression and time of passage through the various stages of digression for twelve separate fish over a 22–36 hour period of treatment. C: A linear regression analysis comparing the rates of progression through the various regression stages (1–5) leading towards the listless phenotype (stage 5) in 5 compared to 6 dpf 6-OHDA treated fish.
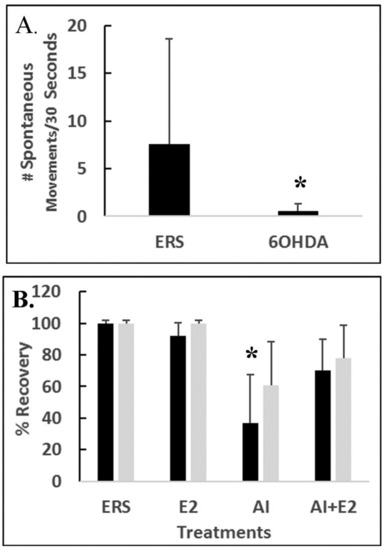
Swimming behaviors of 5dpf treated fish with either ERS, 6-OHDA, E2, or AI. A: Fish treated with ERS or 6-OHDA and tested for the number of spontaneous movements/30 seconds at 3 hours after exposure. B: Percent of fish showing the listless phenotype after 3 hours under various treatments (black bars). Light bars represent percent of recovery from the listless phenotype observed at 6 hours after an ERS washout. Error bars represent ± SD. Asterisk = <italic>p</italic> < 0.05.
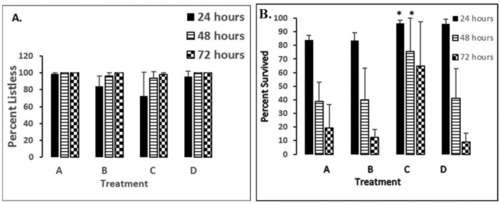
Shows percentages of 5 dpf demonstrating either listless (A.) or survival (B.) phenotypes under various treatment conditions after 24–72 hours of exposure. Error bars represent ± SD. Lettered groups of bars represents the following treatments: A—50 µM nNOSI; B—500 µM 6-OHDA; C—6-OHDA + nNOSI co-treatment; D—6-OHDA + DETA-NO co-treatment. Asterisk = <italic>p</italic> < 0.01 between groups.
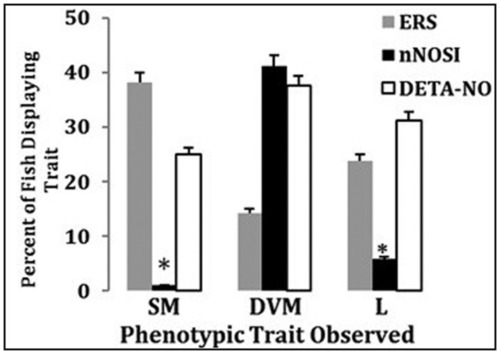
A comparison of prominent characteristics seen within the last three prominent stages (Stages 4–5) of regression (see <xref rid='neurosci-06-01-025-t01' ref-type='table'>Table 1</xref>) leading to the listless phenotype in 5 dpf as a result of fish treated with 6-OHDA for 24 hours and their ability to recover in response to various 8 hour post-treatments (washout) with either ERS, nNOSI, or DETA-NO. Error bars represent ± SD. Lettered groups of bars represents the following phenotypes: SM—spastic movements; DVF—decreased vestibular function; L—listless (hypokinetic). Asterisks = <italic>p</italic> < 0.001 between groups.
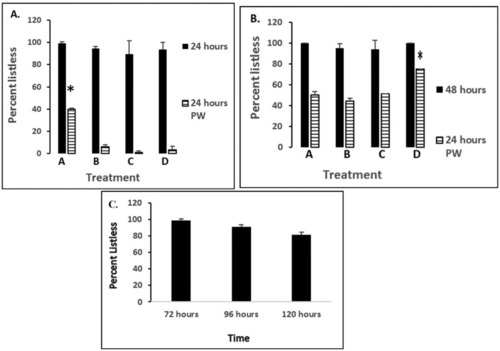
A–B: Demonstration of the effect on 5 dpf fish of prolonged 24–72 hour co-treatments with nNOSI + 6-OHDA (black bars). Light bars represent recovery from the hypokinetic (listless) phenotype after a 24-hour ERS washout. C: Results showing the percent listless phenotype after a 24-hour ERS washout in groups prior treated for 72–120 hours with nNOSI + 6-OHDA. Error bars represent ± SD. PW = time post washout. W = washout. Lettered groups of bars represents the following treatments: A—50 µM nNOSI; B—500 µM 6-OHDA; C—6-OHDA + nNOSI co-treatment; D—6-OHDA + DETA-NO co-treatment. Asterisks = <italic>p</italic> < 0.001 between groups.
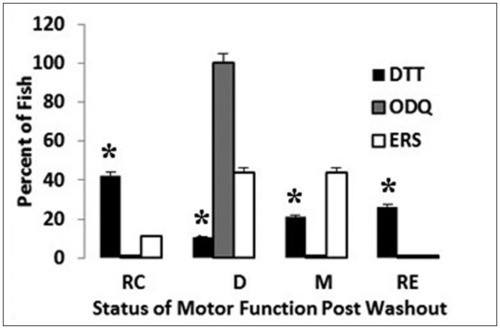
Graph depicting the importance of the two NO pathways in the recovery of 5 dpf fish from data collected at 6.5 hours of post-treatment washouts (ERS, ODQ, or DTT) preceded by a 16 hour neurotoxin treatment with 6-OHDA. Error bars represent ± SD. Lettered groups of bars represents the following phenotypes: RC—recovering; D—declining; M—maintained; R—recovered. Asterisks = <italic>p</italic> < 0.001 between groups.
Acknowledgments
This image is the copyrighted work of the attributed author or publisher, and
ZFIN has permission only to display this image to its users.
Additional permissions should be obtained from the applicable author or publisher of the image.
Full text @ AIMS Neurosci
Your Input Welcome
Thank you for submitting comments. Your input has been emailed to ZFIN curators who may contact you if
additional information is required.
Oops. Something went wrong. Please try again later.