
- Title
-
A calibrated optogenetic toolbox of stable zebrafish opsin lines
- Authors
- Antinucci, P., Dumitrescu, A., Deleuze, C., Morley, H.J., Leung, K., Hagley, T., Kubo, F., Baier, H., Bianco, I.H., Wyart, C.
- Source
- Full text @ Elife

(A) List of selected opsins, with spectral absorption and opsin class. (B) Schematics of expression patterns in the GAL4 transgenic driver lines used in this study. (C) Opsin expression in spinal neurons in Tg(mnx1:GAL4;UAS:opsin-FP) larvae at 5 dpf (for eNpHR3.0, the s1020t:GAL4 transgene was used). Insets show magnified cell bodies to illustrate opsin membrane expression (for insets, brightness and contrast were adjusted independently for each opsin to aid visualisation). A, anterior; D, dorsal; P, posterior; V, ventral. Scale bar 20 μm in large images, 5 μm in insets. (D) Behavioural assays and corresponding figure numbers. (E) In vivo electrophysiological recordings and figure numbers. See also Figure 1—figure supplement 1. |

( |

(A) Experimental setup for optogenetic stimulation and behavioural monitoring. IR, infrared. (B) Schematic of behavioural assay. (C) Opsin expression in trigeminal neurons in a Tg(isl2b:GAL4;UAS:CoChR-tdTomato) embryo at 1 dpf. Imaging field of view corresponds to black box in (B). A, anterior; D, dorsal; P, posterior; V, ventral. Scale bar 50 μm. (D) Tg(isl2b:GAL4;UAS:CoChR-tdTomato) embryos positioned in individual agarose wells. Behaviour was monitored at 1000 frames per second across multiple embryos (28–30 hpf; N = 69 ± 26 fish per opsin group, mean ± SD) subjected to 5 or 40 ms pulses of full-field illumination (470 or 590 nm, 4.5–445 μW/mm2) with a 15 s inter-stimulus interval. (E) Optogenetically-triggered escape responses detected from ΔPixel traces in the three embryos indicated in (D). Dotted line indicates maximum latency (200 ms) for a response to be considered optogenetically-triggered. (F,G) Response probability for transient (E) or stable (F) transgenic embryos expressing different opsins (mean ± SEM, across fish). Insets show response latency for 5 ms blue light pulses in CoChR-expressing embryos (median ± 95% CI, across fish). See also Figure 2—figure supplements 1 and 2 and Figure 2—video 1. |

( |

( |

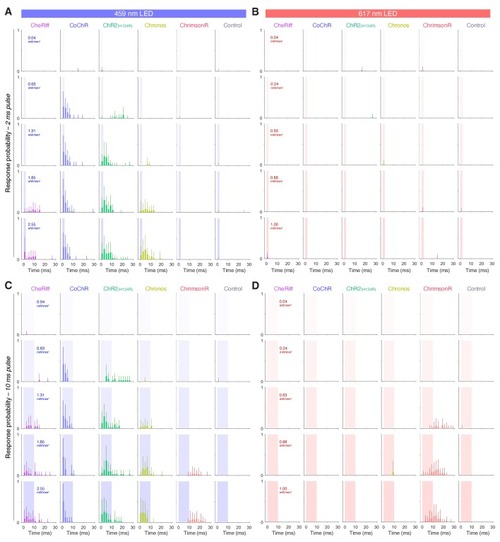
(A) Schematics of behavioural assay. Head-restrained, tail-free larvae (6 dpf; N = 28 ± 8 fish per opsin group, mean ± SD) were exposed to 2 or 10 ms pulses of light (459 or 617 nm, 0.04–2.55 mW/mm2) with a 20 s inter-stimulus interval while their behaviour was monitored at 500 fps. We also provided 250 ms trains of light pulses at 20 or 40 Hz. (B) Opsin expression in spinal motor neurons in a Tg(mnx1:GAL4;UAS:CoChR-tdTomato) larva at 5 dpf. Imaging field of view corresponds to black box in (A). A, anterior; D, dorsal; P, posterior; V, ventral. Scale bar 50 μm. (C) Swim bouts elicited by a pulse train in Tg(mnx1:GAL4;UAS:CoChR-tdTomato) larvae (left). The control, opsin-negative larva (right), does not respond within 148 ms after stimulus onset. (D) Tail tracking, showing optogenetically-evoked swim bouts in a CoChR-expressing larva (bottom three rows) and a visually-evoked swim in a control opsin-negative larva (top). tbf, tail beat frequency. (E) Distribution of response latencies for all tail movements in opsin-expressing (red) and control opsin-negative larvae (grey). Dotted line indicates maximum latency (50 ms) for a response to be considered optogenetically-triggered. Control larvae exclusively show long latency responses. Each time bin corresponds to 25 ms. (F,L) Response probability of larvae expressing different opsins for single-pulse (F) or pulse-train (L) stimulation (mean ± SEM, across fish). G–Q Latency (G,M), bout duration (H,N), tail angle of the first half beat (θ1; I,O), number of cycles (J,P) and tail beat frequency (K,Q) for single-pulse (G–K) or pulse-train (M–Q) stimulation (mean ± SEM, across fish). See also Figure 3—figure supplement 1 and Figure 3—videos 1 and 2. |
( |

(A) Schematics of experimental setup for optogenetic stimulation with in vivo whole-cell patch clamp recordings. Image shows a patched primary motor neuron (pMN) expressing CoChR in a 6 dpf Tg(mnx1:GAL4;UAS:CoChR-tdTomato) larva. Scale bar 5 μm. (B) Membrane resistance was not affected by opsin expression (mean ± SD, across cells). (C) Resting membrane potential was similar between opsin-expressing and control neurons (mean ± SD). (D) Examples of inward photocurrents in response to 5 ms light pulses (20 mW/mm2). (E) Peak photocurrent amplitude. CoChR and ChrimsonR induced the largest photocurrents (mean ± SEM, across cells). Dotted lines show range of pMN rheobase. Data is pooled across stimulus intensity (1–30 mW/mm2) but see Figure 4—figure supplement 1 for currents at varying irradiance. (F) Photocurrent activation time was similar across opsins (mean ± SEM). (G) Chronos photocurrents had the fastest deactivation time constant, while CoChR and ChrimsonR showed similar deactivation kinetics (mean ± SEM). See also Figure 4—figure supplement 1. |

( |

( |

CoChR and ChrimsonR can elicit spiking in primary motor neurons. (A) Example membrane depolarisations induced by 5 ms light pulses (20 mW/mm2). (B) Number of optogenetically-evoked spikes vs. pulse duration (across irradiance levels 1–30 mW/mm2). Longer pulse duration induced more spikes in both CoChR- and ChrimsonR-expressing cells. Left plots show single neurons and right plot shows mean ± SEM across cells. (C) Example voltage responses from CoChR- and ChrimsonR-expressing cells upon pulse train stimulation (1–100 Hz, 2–5 ms pulse duration). (D) Number of spikes vs. pulse number within a train (mean ± SEM, across cells; shaded area depicts average number of spikes is below 1). In CoChR-expressing cells, the initial 3–4 pulses within the train induced bursts of 2–4 spikes. (E) Heatmap of mean spike number elicited via CoChR stimulation, separated according to stimulation frequency and pulse duration. Primary motor neurons often responded with bursts of action potentials, even for short light pulses. (F) Example responses to the 1st (top) and last (bottom) 0.5 ms light pulse in a train, recorded from a CoChR-positive neuron. (G) Spike latency vs. pulse frequency (mean ± SEM). (H) Spike jitter (mean ± SEM) vs. pulse frequency shows that ChrimsonR-expressing cells exhibited lower spike jitter than CoChR-expressing cells. See also Figure 5—figure supplement 1. |

(A) Schematic of the behavioural assay. (B) Opsin expression in spinal motor neurons and interneurons in a Tg(s1020t:GAL4;UAS:GtACR1-tdTomato) embryo at 1 dpf. Imaging field of view corresponds to black box in (A). A, anterior; D, dorsal; P, posterior; V, ventral. Scale bar 50 μm. (C) Camera field of view showing Tg(s1020t:GAL4;UAS:GtACR1-tdTomato) embryos positioned in individual agarose wells. Behaviour was monitored at 50 frames per second across multiple embryos (24–27 hpf; N = 91 ± 16 fish per group, mean ± SD) subjected to 10 s light periods (470 or 590 nm, 0–227 μW/mm2) with a 50 s inter-stimulus interval. (D) Tracking of coiling behaviour (mean ΔPixel from three trials) for the three embryos shown in (C). Black arrow indicates movements at light onset, whereas grey arrowhead indicates synchronised restart of coiling behaviour following light offset. (E) Optogenetically-induced changes in coil rate (mean + SD, across fish) in embryos expressing the anion channelrhodopsin GtACR1 (N = 77 embryos, top) or the Cl– pump eNpHR3.0 (N = 111 embryos, bottom). Horizontal dark grey bars indicate the’ late LED On’ period. Each time bin corresponds to 2 s. (F,G) Normalised coil rate during the’ late LED On’ period in embryos expressing different opsins (mean ± SEM, across fish). Control opsin-negative siblings were subjected to the same light stimuli. See also Figure 6—figure supplements 1 and 2 and Figure 6—video 1. |

( |

( |

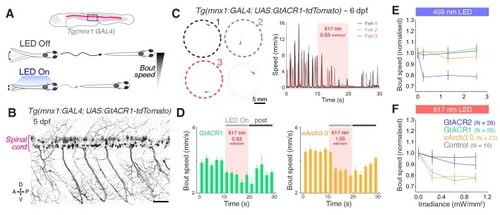
(A) Schematic of behavioural assay. (B) Opsin expression in spinal motor neurons and interneurons in a Tg(s1020t:GAL4;UAS:GtACR1-tdTomato) larva at 5 dpf. Imaging field of view corresponds to black box in (A). A, anterior; D, dorsal; P, posterior; V, ventral. Scale bar 50 μm. (C) Tg(s1020t:GAL4;UAS:GtACR1-tdTomato) larvae were positioned in individual agarose wells (left) and instantaneous swim speed was monitored by centroid tracking (right) at 50 fps (six dpf; N = 25 ± 9 fish per group, mean ± SD). 10 s light periods were delivered (459 or 617 nm, 0–2.55 mW/mm2) with a 50 s inter-stimulus interval. (D) Optogenetically-induced changes in bout rate (mean + SEM, across fish) in Tg(s1020t:GAL4) larvae expressing GtACR1 (N = 24 larvae, left) or eNpHR3.0 (N = 40 larvae, right). Horizontal grey bars indicate the time windows used to quantify behavioural changes. Each time bin corresponds to 2 s. (E,F) Normalised bout rate during the `LED On` period in larvae expressing different opsins (mean ± SEM, across fish) and in control, opsin-negative, siblings. See also Figure 7—figure supplements 1–4 and Figure 7—video 1. |

( |

( |
( |

( |

( |

(A) Action of anion channelrhodopsins (top) and Cl–/H+ pumps (bottom). For anion channelrhodopsins, photocurrent magnitude and direction depend on chloride reversal potential (ECl) and holding potential (Vhold), while Cl–/H+ pumps always induce outward currents. (B) Example photocurrents in response to a 1 s light exposure (20 mW/mm2). (C,D) Photocurrent peak (C) and steady-state (D) amplitude (mean ± SEM, across cells). GtACRs induced larger photocurrents than Cl–/H+ pumps. (E–G) Photocurrent activation (E), inactivation (F) and deactivation (G) time constants (mean ± SEM). Photocurrents induced by Cl–/H+ pumps showed minimal inactivation and faster deactivation kinetics than GtACRs. eNpHR3.0 photocurrents did not inactivate hence no inactivation time constant was computed. See also Figure 8—figure supplement 1. |

( |

(A) Example voltage deflections induced by anion channelrhodopsins and Cl–/H+ pumps in response to a 1 s light pulse (20 mW/mm2). (B–D) Peak (B) and steady-state (C) responses and deactivation time constant (D) of voltage deflections. All opsins induced similar absolute voltage changes. Anion channelrhodopsins generated depolarisation with both intracellular solutions while Cl–/H+ pumps generated hyperpolarisation. (E) Example recordings demonstrating inhibition of single spikes in GtACR1- and eNpHR3.0-expressing cells with 5 ms light pulses (3 mW/mm2). (F) Fraction of spikes that were optogenetically inhibited (mean ± SEM, across cells). All opsins achieved high suppression efficacy, but GtACR1 induced additional spikes upon light delivery with the embryonic intracellular solution. (G) Example recordings demonstrating inhibition of sustained spiking in GtACR1- and eNpHR3.0-expressing cells. (H) Quantification of suppression using protocol illustrated in (G). Number of spikes per 50 ms during light delivery (0–10 mW/mm2) is plotted against irradiance. GtACR1 and eNpHR3.0 inhibited tonic spiking with similar efficacy (mean ± SEM). See also Figure 9—figure supplement 1. |

( |