
- Title
-
Oxidative Stress Mediates Anxiety-Like Behavior Induced by High Caffeine Intake in Zebrafish: Protective Effect of Alpha-Tocopherol
- Authors
- de Carvalho, T.S., Cardoso, P.B., Santos-Silva, M., Lima-Bastos, S., Luz, W.L., Assad, N., Kauffmann, N., Passos, A., Brasil, A., Bahia, C.P., Moraes, S., Gouveia, A., de Jesus Oliveira Batista, E., Oliveira, K.R.M.H., Herculano, A.M.
- Source
- Full text @ Oxid Med Cell Longev
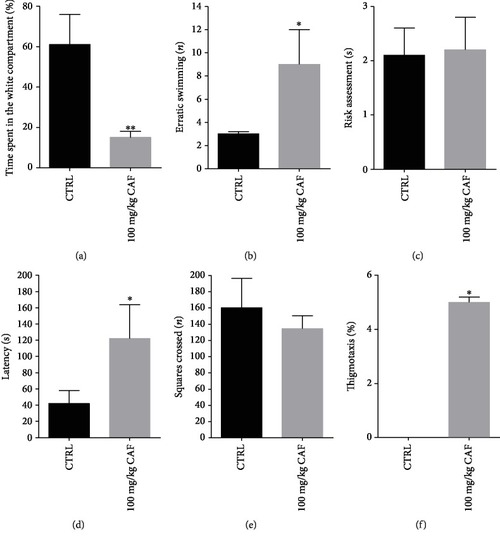
Effect of caffeine on (a) time spent in the white compartment, (b) erratic swimming, (c) risk assessment, (d) latency, (e) squares crossed, and (f) thigmotaxis in the scototaxis test. Bar graphs represent the mean ± standard error. Data were compared using the ANOVA-one way test followed by the Tukey test. ∗ PHENOTYPE:
|
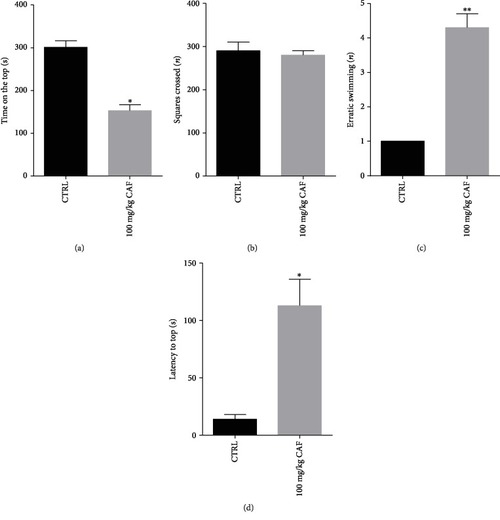
Effect of caffeine on (a) time on the top, (b) squares crossed, (c) erratic swimming, and (d) latency on the top in the geotaxy test. Bar graphs represent the mean ± standard error. Data were compared using the ANOVA-one way test followed by the Tukey test. ∗∗ PHENOTYPE:
|
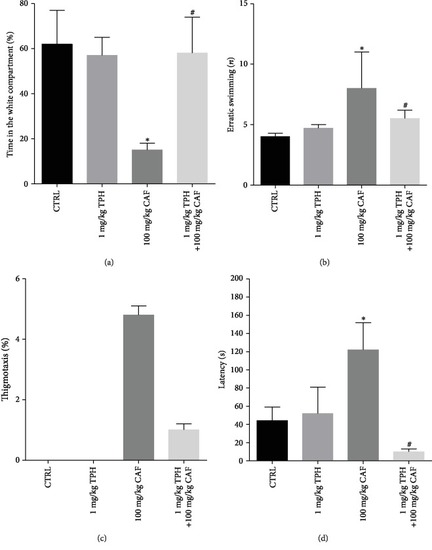
Effect of alpha-tocopherol on (a) time spent in the white compartment, (b) erratic swimming, (c) risk assessment, (d) latency, (e) squares crossed, and (f) thigmotaxis in the scototaxis of zebrafish treated with caffeine. Bar graphs represent the mean ± standard error. Data were compared using the ANOVA-one way test followed by the Tukey test. ∗ PHENOTYPE:
|
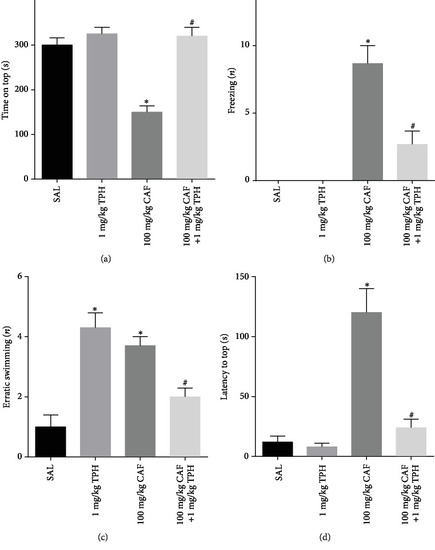
Effect of alpha-tocopherol on (a) time on the top, (b) squares crossed, (c) erratic swimming, and (d) latency on the top in the geotaxy of zebrafish treated with caffeine. Bar graphs represent the mean ± standard error. Data were compared using the ANOVA-one way test followed by the Tukey test. ∗ PHENOTYPE:
|
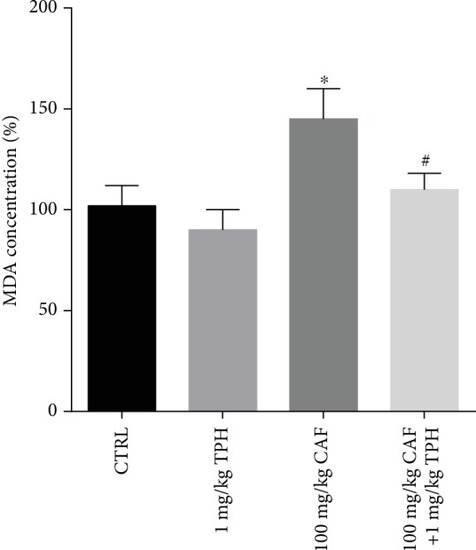
Lipid peroxidation in the brain of zebrafish treated with caffeine or caffeine and alpha-tocopherol. Data are expressed as percent of control and compared using the ANOVA-one way test followed by the Tukey test. ∗ PHENOTYPE:
|