
Image
|
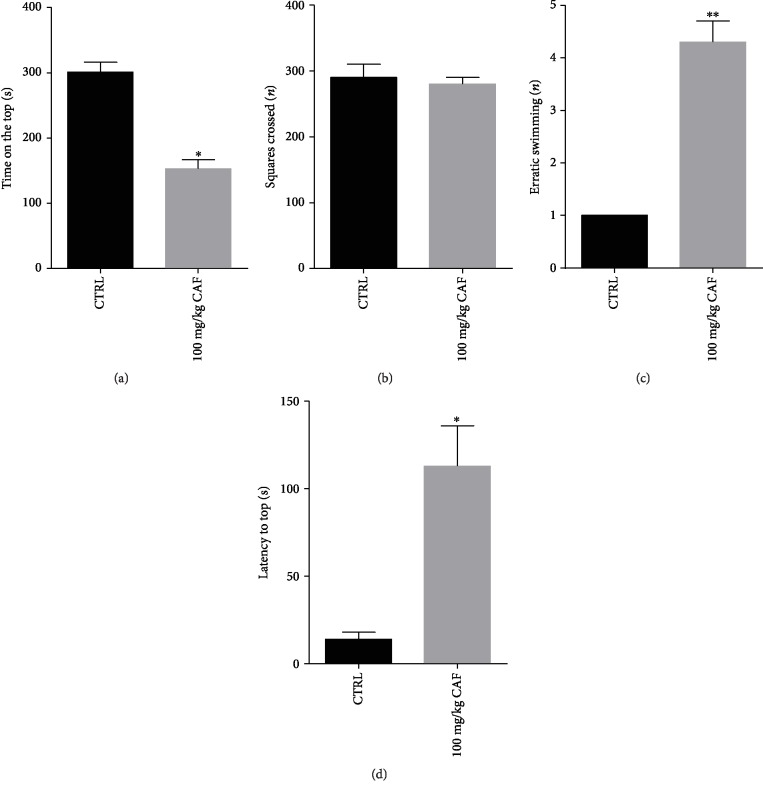
Figure Caption
Figure 2
Effect of caffeine on (a) time on the top, (b) squares crossed, (c) erratic swimming, and (d) latency on the top in the geotaxy test. Bar graphs represent the mean ± standard error. Data were compared using the ANOVA-one way test followed by the Tukey test. ∗∗
Figure Data
Acknowledgments
This image is the copyrighted work of the attributed author or publisher, and
ZFIN has permission only to display this image to its users.
Additional permissions should be obtained from the applicable author or publisher of the image.
Full text @ Oxid Med Cell Longev