
- Title
-
Microglial response patterns following damage to the zebrafish olfactory bulb
- Authors
- Var, S.R., Byrd-Jacobs, C.A.
- Source
- Full text @ IBRO Rep
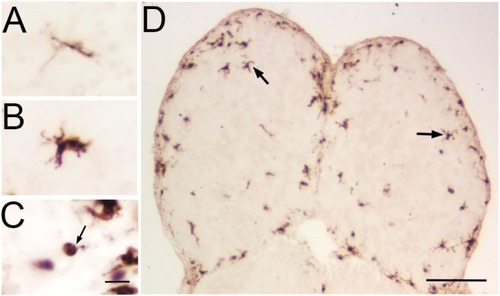
Microglial morphologies in the olfactory bulb. Microglia in the olfactory bulbs can transform from a “ramified, resting” sensorial cell (A) through a “transitioning” morphology (B) to an “amoeboid, actived" phagocytic state (C, arrow) in 3 types of morphologies evident with 4C4 labeling. Olfactory bulbs of an untreated control fish (D) labeled with 4C4 antibody showed comparable levels of 4C4-ir in both olfactory bulbs, and most profiles exhibited the ramified morphology (arrows). Scale bar =20 μm for A, B, C; 100 μm for D. |

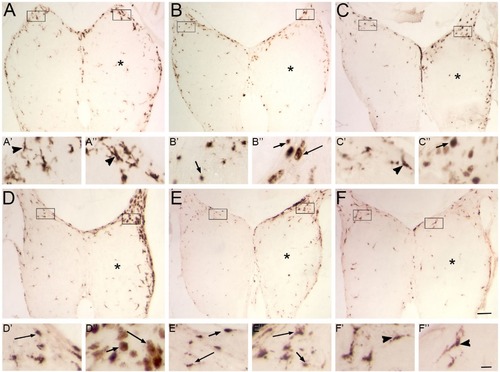
Patterns of 4C4-ir microglial profiles after deafferentation by cautery. Olfactory bulbs after deafferentation by cautery of the right olfactory organ were labeled with 4C4. Boxes indicate areas magnified in A’-F”. A) At 1 h, there was no apparent difference in distribution of 4C4-ir profiles between the left, internal control and right, deafferented (*) olfactory bulbs. The few 4C4-ir profiles had a ramified (arrowheads) morphology in both the left (A’) and right (A”) bulbs. B) At 4 h, there was a substantial increase in 4C4-ir profiles in the injured bulb (*). In the intact bulb, labeled profiles were ramified (B’), while on the deafferented side, most 4C4-ir profiles showed an amoeboid (arrow) morphology (B”). C) At 12 h, the tissue appeared to be inflamed, and there were fewer 4C4-ir profiles in both olfactory bulbs than the previous timepoint. Most labeled profiles were of the ramified morphology in the intact (C’) and the damaged (C”) bulbs. D) At 24 h, there was another increase in 4C4-ir profiles in the deafferented bulb (*). While the intact bulb (D’) continued to exhibit ramified microglia, the deafferented bulb (D”) showed more amoeboid microglia. E) At 48 h, there were even more 4C4-ir profiles in the deafferented bulb (*), and while the intact bulb showed ramified microglia (E’) the affected bulb displayed many amoeboid and transitioning (long arrows) morphologies (E”). F) At 72 h, the total level of microglia continued to increase in the deafferented bulb (*). The intact bulb had ramified cells (F’), while the deafferented bulb showed mostly microglia with the transitioning morphology (F”). Scale bar =200 μm for A–F; 20 μm for A’-F”. |
Patterns of 4C4-ir microglial profiles after deafferentation by chemical ablation. Olfactory bulbs deafferented by chemical ablation of the sensory epithelium of the right olfactory organ were labeled with 4C4. Boxes indicate areas magnified in A’-F”. A) At 1 h, there appeared to be no difference in 4C4 labeling between left, intact and right, deafferented (*) bulbs. There was a small increase in ramified (arrowheads) microglial profiles around the periphery of both the intact (A’) and deafferented (A”) olfactory bulbs. B) At 4 h, there was still no obvious change in 4C4 labeling with deafferentation (*). There seemed to be more amoeboid (arrows) and transitioning (long arrow) in both olfactory bulbs (B’, B”). C) At 12 h, there seemed to be more 4C4 profiles on the deafferented side (*), and there was a noticeable increase in amoeboid profiles in the right olfactory bulb (C”) compared to the internal control side (C’). D) At 24 h, there appeared to be an increase in total number of microglia in the affected bulb (*); most of the profiles were in the olfactory nerve layer and were of the amoeboid and transitioning morphology (D’, D”). E) At 48 h, the 4C4 profiles in the deafferented bulb (*) were localized to the olfactory nerve layer. Most profiles at this time point were transitioning or amoeboid in both olfactory bulbs (E’, E”). F) At 72 h, the distribution of 4C4-ir profiles resembled control fish. Most labeled profiles continued to exhibit primarily the ramified morphologies (F’, F”). Scale bar =200 μm for A–F; 20 μm for A’-F”. |

Patterns of 4C4-ir microglial profiles after direct lesioning. Olfactory bulbs after a direct lesion to the right olfactory bulb (*) and labeled with 4C4. Boxes indicate areas magnified in A’-F”. A) At 1 h, there were very few 4C4-ir profiles in either bulb. The scant immunoreactive profiles were of the transitioning (long arrows) morphology in both intact (A’) and lesioned (A”) bulbs. B) At 4 h, there was a noticeable increase in labeled profiles in both bulbs, and most exhibited transitioning and amoeboid (arrows) morphologies in both olfactory bulbs (B’, B”). C) At 12 h, there was an accumulation of labeled cells along the presumptive site of the wound. Higher magnification revealed transitioning profiles in the intact bulb (C’), and especially numerous in the lesioned olfactory bulb (C”). D) At 24 h, there were fewer 4C4-ir profiles and they were observed around the bulb periphery. In the intact bulb, profiles were few and of the transitioning morphology (D’); the lesioned bulb had many more 4C4 profiles, but they also were mostly the transitioning shape (D”). At 48 h (E) and 72 h (F), total microglial profiles slowly decreased to near-control levels (E’, E”, F’, F”) and exhibited mostly transitioning morphology. Scale bar =200 μm for A–F; 20 μm for A’-F”). |