
|
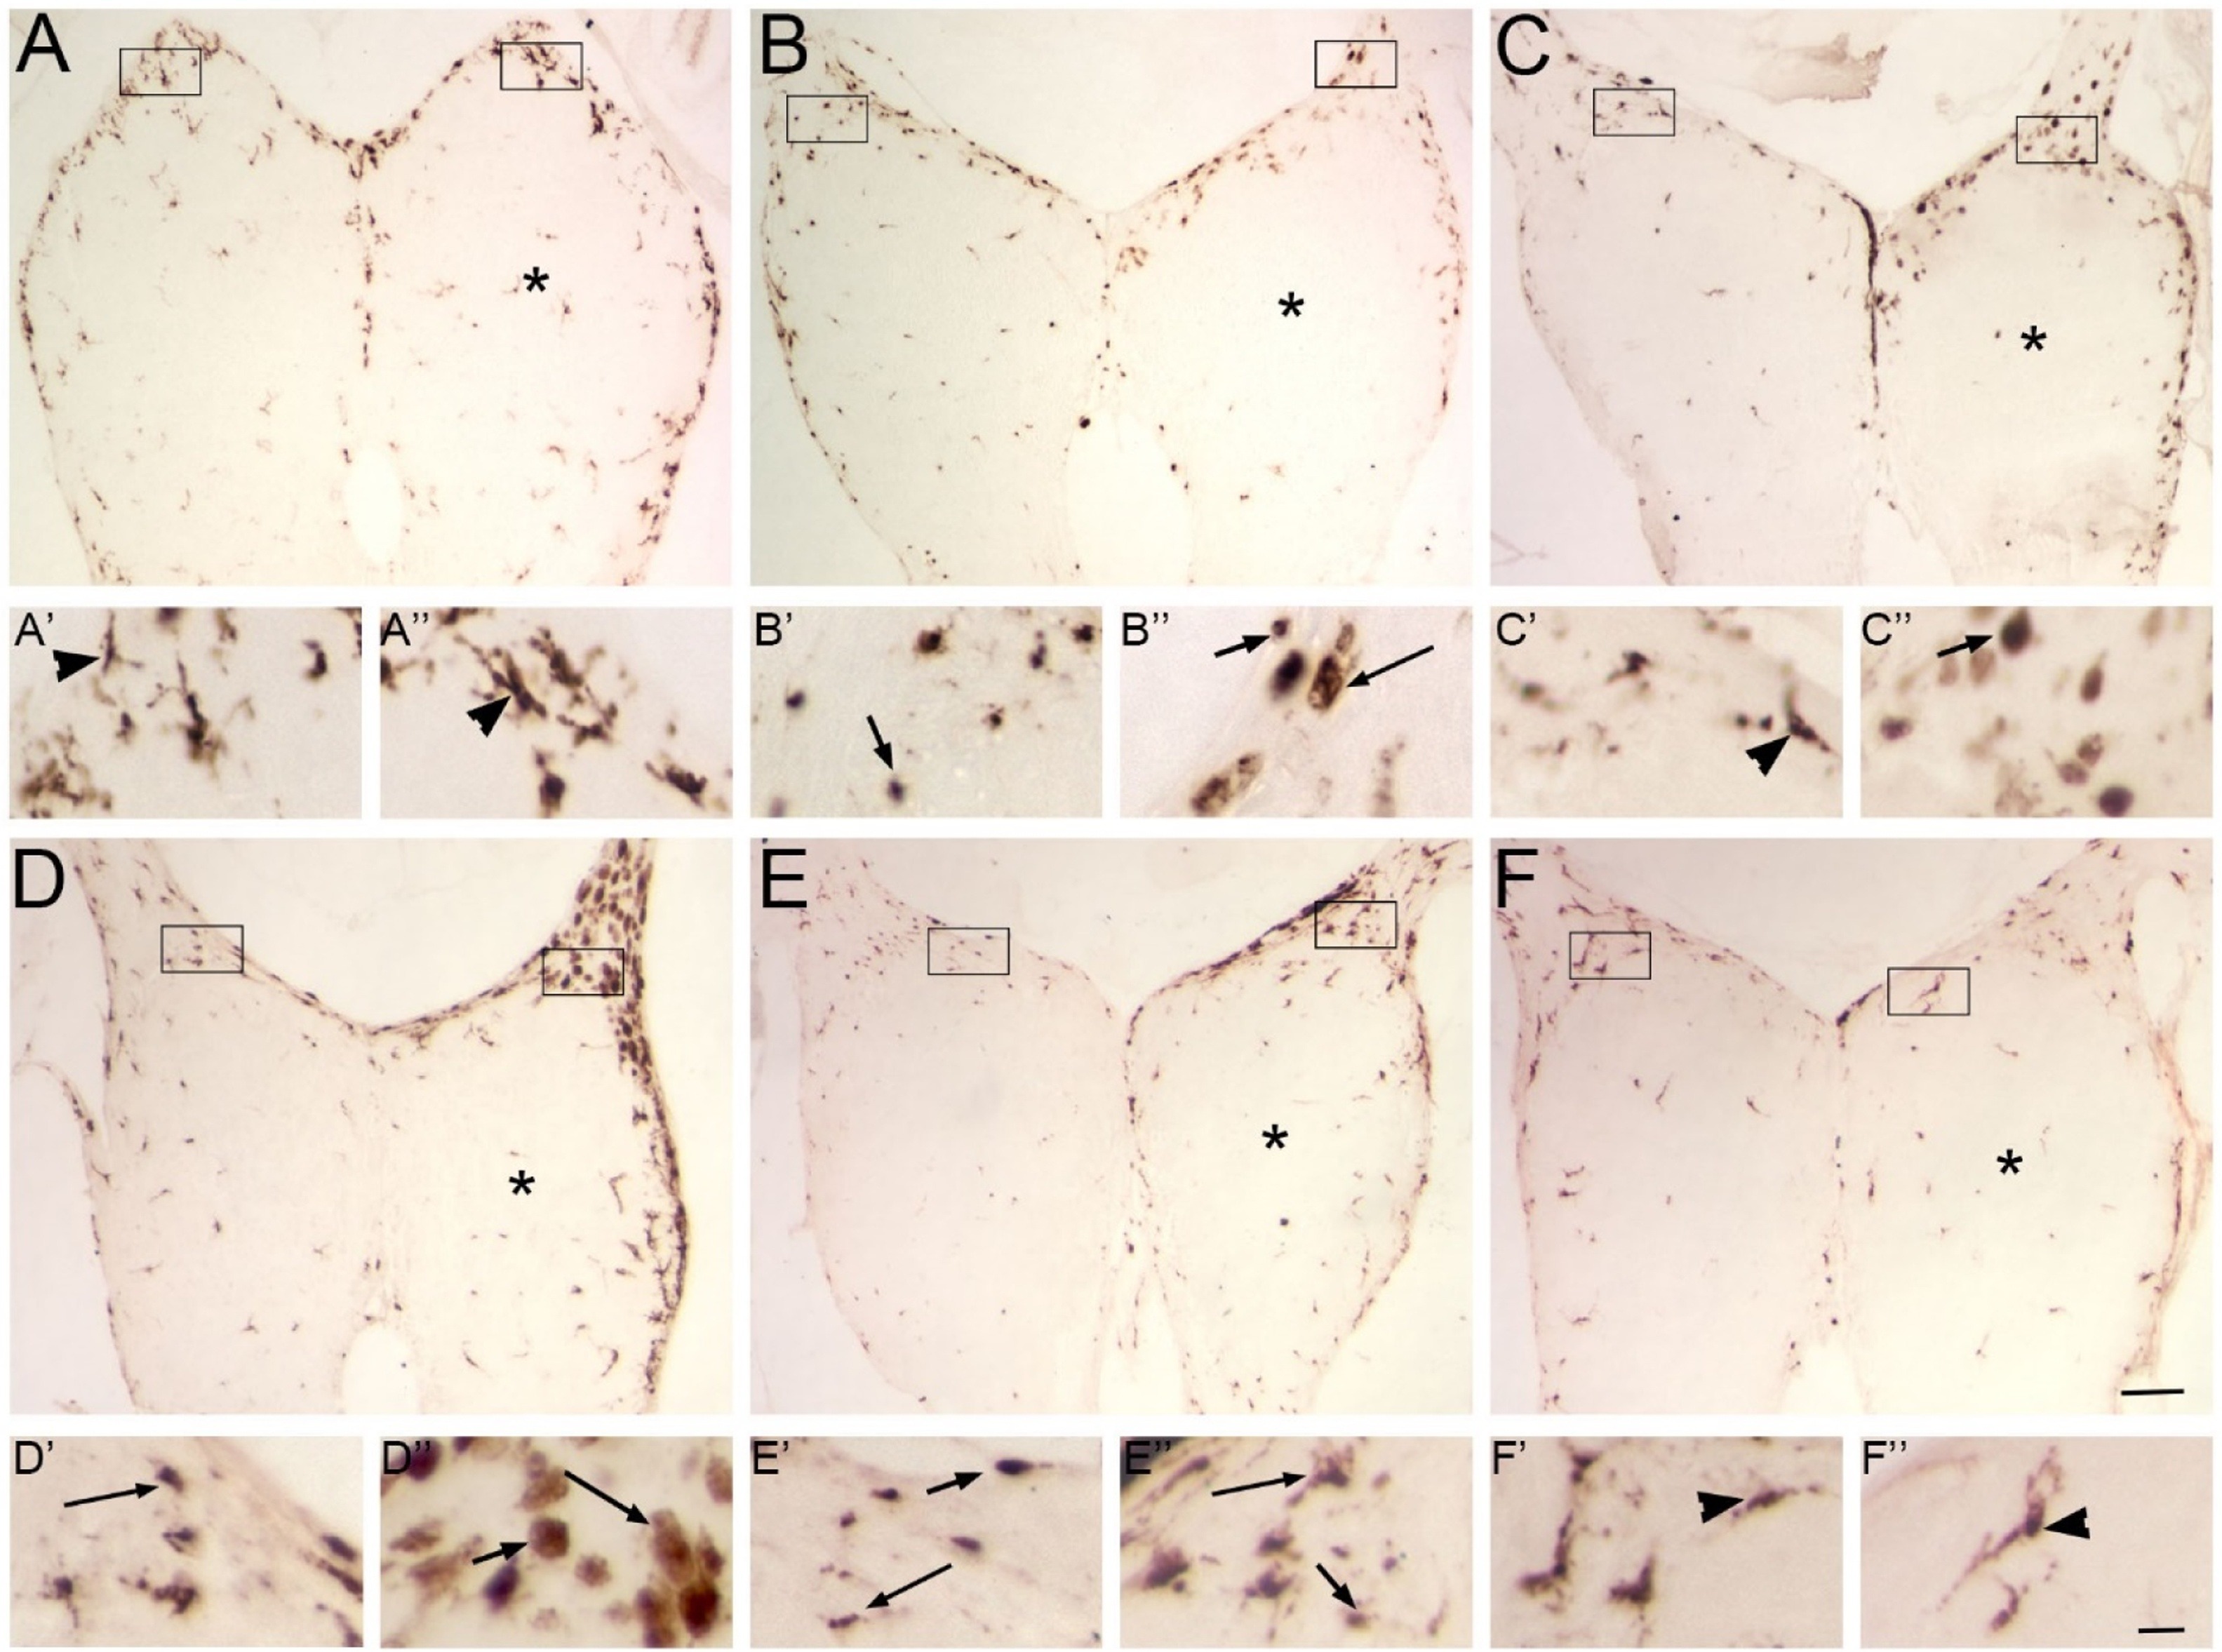
Fig. 7
Patterns of 4C4-ir microglial profiles after direct lesioning.
Olfactory bulbs after a direct lesion to the right olfactory bulb (*) and labeled with 4C4. Boxes indicate areas magnified in A’-F”. A) At 1 h, there were very few 4C4-ir profiles in either bulb. The scant immunoreactive profiles were of the transitioning (long arrows) morphology in both intact (A’) and lesioned (A”) bulbs. B) At 4 h, there was a noticeable increase in labeled profiles in both bulbs, and most exhibited transitioning and amoeboid (arrows) morphologies in both olfactory bulbs (B’, B”). C) At 12 h, there was an accumulation of labeled cells along the presumptive site of the wound. Higher magnification revealed transitioning profiles in the intact bulb (C’), and especially numerous in the lesioned olfactory bulb (C”). D) At 24 h, there were fewer 4C4-ir profiles and they were observed around the bulb periphery. In the intact bulb, profiles were few and of the transitioning morphology (D’); the lesioned bulb had many more 4C4 profiles, but they also were mostly the transitioning shape (D”). At 48 h (E) and 72 h (F), total microglial profiles slowly decreased to near-control levels (E’, E”, F’, F”) and exhibited mostly transitioning morphology. Scale bar =200 μm for A–F; 20 μm for A’-F”).