FIGURE SUMMARY
Title

Anti-inflammatory and Regulatory Effects of Huanglian Jiedu Decoction on Lipid Homeostasis and the TLR4/MyD88 Signaling Pathway in LPS-Induced Zebrafish

Authors
Zhou, J., Gu, X., Fan, X., Zhou, Y., Wang, H., Si, N., Yang, J., Bian, B., Zhao, H.
Source
Full text @ Front. Physiol.

Representative pictures of transgenic neutrophils labeling in zebrafish yolks at 3 dpf. (A) Control group. (B) Lipopolysaccharide (LPS) group. (C) Indomethacin group. (D) 50.0 μg/mL Huanglian Jiedu decoction (HLJDD) group. (E) 62.5 μg/mL Berberine group. (F) 250 μg/mL Baicalin group. (G) 500 μg/mL Geniposide group. Green fluorescence represents the transgenic neutrophils.

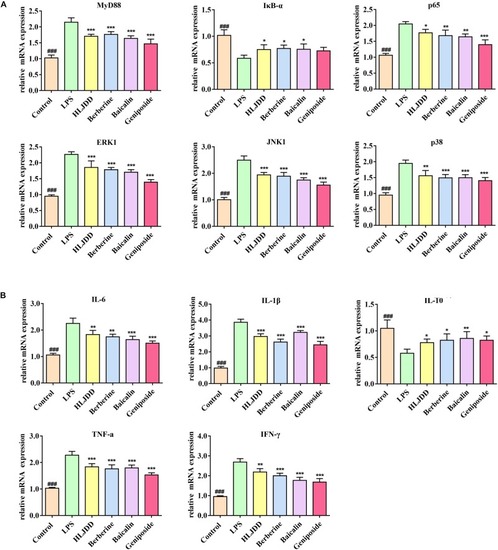
Huanglian Jiedu decoction (HLJDD) and its three major components alleviated the mRNA expression of the key mediators and inflammatory cytokines. (A) HLJDD and its three major components could inhibit lipopolysaccharide (LPS)-induced inflammation by ameliorating the mRNA expression of MyD88, p65, IκB-α, ERK, JNK, and p38 controlled by the TLR4/MyD88 pathway. (B) HLJDD and its three major components ameliorated IL-6, IL-1β, TNF-α, IL-10, and IFN-γ to return to normal level. P < 0.05, ∗∗P < 0.01, and ∗∗∗P < 0.001, four drug treatment groups compared to the LPS group. ###P < 0.001, LPS group compared to the control group. MyD88: Binding Toll-like Receptor. p65: Response to cytokine. IκB-α: Negative regulation of NF-κB transcription factor activity. ERK, JNK, p38: Activation of MAPK activity. IL-6, IL-1β, TNF-α, IL-10, IFN-γ: Regulation of inflammatory response.

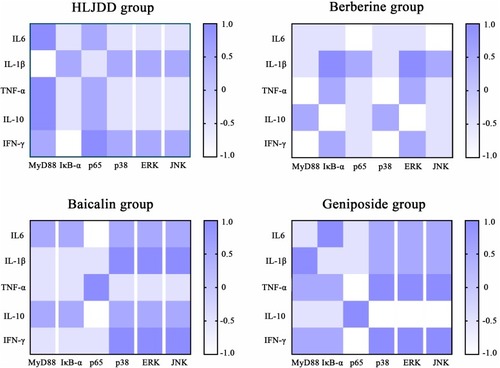
Correlation analysis of inflammatory cytokines and mediators of the TLR4/MyD88 signaling pathway in each drug treatment group. The color scale illustrates the magnitude of correlation between the examined indexes on the plot.

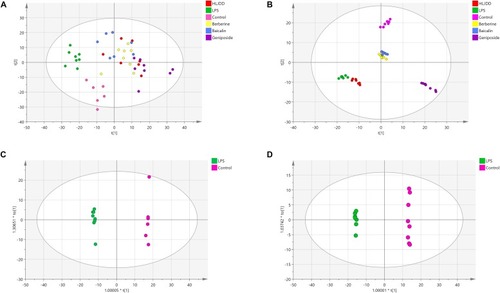
Principal component analysis (PCA) scores of zebrafish samples in six groups and orthogonal projection to latent structures discriminant analysis (OPLS-DA) scores in the control group and lipopolysaccharide (LPS) group. (A) PCA analysis in ESI+ mode. (B) PCA analysis in ESI mode. (C) OPLS-DA analysis in ESI+ mode. (D) OPLS-DA analysis in ESI mode. Red, green, pink, yellow, blue, and purple symbols represent samples of the HLJDD, LPS, control, berberine, baicalin, and geniposide groups, respectively.

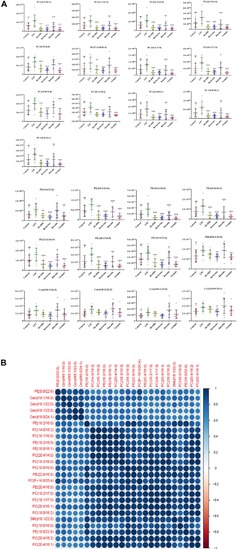
Multivariate statistical analysis of the lipopolysaccharide (LPS) group and control group. (A) The metabolic changes of 25 potential lipid markers in LPS group. P < 0.05, ∗∗P < 0.01, and ∗∗∗P < 0.001, four drug treatment groups compared to the LPS group. #P < 0.05 and ##P < 0.01, LPS group compared to the control group. (B) Relationship of correlation matrix between clusters of 25 potential lipid markers. Different color scales reflect the magnitude and direction of correlation between different lipids. Blue and red indicate positive and negative correlations, respectively.

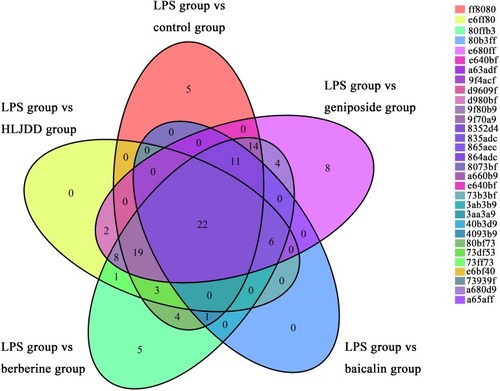
Venn diagram, in which each ellipse represents the potential lipid markers based on comparisons of the lipopolysaccharide (LPS) group vs. drug treatment groups and LPS group vs. the control group.

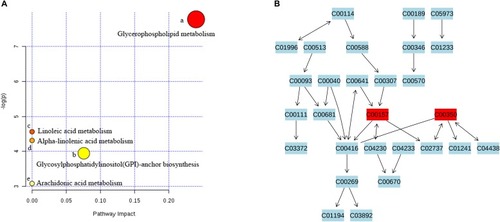
Metabolic pathway analysis and visualization of Huanglian Jiedu decoction (HLJDD) treatment. (A) Summary of metabolomics pathway analysis based on the KEGG database. All matched pathways are presented as circles, including glycerophospholipid metabolism (a); glycosylphosphatidylinositol (GPI)-anchor biosynthesis (b); linoleic acid metabolism (c); alpha-linolenic acid metabolism (d); and arachidonic acid (AA) metabolism (e) from significantly differential lipids. The color and size of each circle are based on P-value and pathway impact value, respectively. (B) Pathway of glycerophospholipid metabolism with metabolomics pathway analysis based on the KEGG database. The matched metabolite numbers are consistent with the KEGG database.

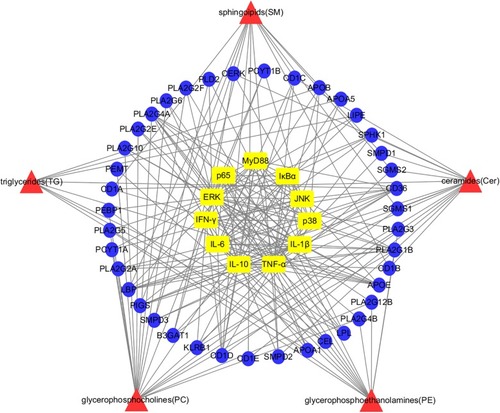
Network visualization analysis of “potential lipid markers-lipoproteins-TLR4/MyD88 signaling pathways” for anti-inflammatory effects of HLJDD. Red area: differentially expressed species of lipid markers; Blue area: corresponding lipoproteins of lipid markers; Yellow area: cytokines and proteins of the TLR4/MyD88 signaling pathways.

Acknowledgments
This image is the copyrighted work of the attributed author or publisher, and ZFIN has permission only to display this image to its users. Additional permissions should be obtained from the applicable author or publisher of the image. Full text @ Front. Physiol.