
- Title
-
miR-27a/b is a posttranscriptional regulator of Gpr126 (Adgrg6)
- Authors
- Musa, G., Srivastava, S., Petzold, J., Cazorla-Vázquez, S., Engel, F.B.
- Source
- Full text @ Ann N Y Acad Sci
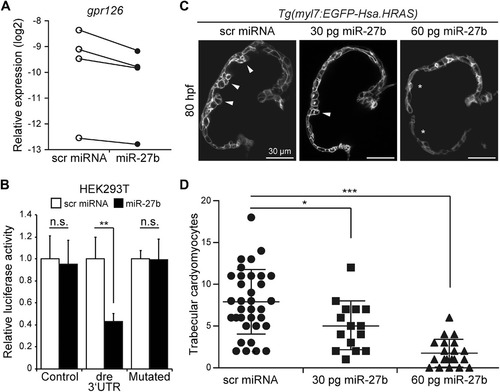
miR‐27b expression phenocopies gpr126 morphant heart phenotype in zebrafish. (A) Expression of gpr126 at 80 hpf in zebrafish embryos, which were injected with miR‐27b at single cell stage in comparison with scr miRNA controls. White circles represent scr miRNA–injected and black circles represent miR‐27b–injected embryos of four different clutches. Expression was quantified by qPCR and is shown as normalized to a log2 scale. n = 4; P ≤ 0.05. (B) Relative luciferase activity in HEK293T cells expressing the control construct (control), construct containing the 3′ UTR of zebrafish gpr126 (dre 3′ UTR), or the mutated 3′ UTR (mutated) in the presence of scr miRNA control or miR‐27b. Data are mean ± SD; n = 8; ** P ≤ 0.01; n.s., not statistically significant. (C) Representative images of zebrafish embryonic heart ventricles of 30 or 60 pg scr miRNA– and miR‐27b–injected Tg(myl7:EGFP‐Hsa.HRAS) embryos at 80 hpf. White arrowheads indicate trabeculae. White asterisks indicate the absence of trabeculae at 80 hpf. (D) Scatter plot graph showing the number of trabecular cardiomyocytes in scr miRNA– and miR‐27b‐3p–injected zebrafish embryos at 80 hpf. Trabecular cardiomyocytes were counted in 35 embryos for scr miRNA, 15 embryos for 30 pg miR‐27b, and in 20 embryos for 60 pg miR‐27b of four clutches for each condition. Data are mean ± SD; n = 4; * P ≤ 0.05; ** P ≤ 0.01; *** P ≤ 0.001. |
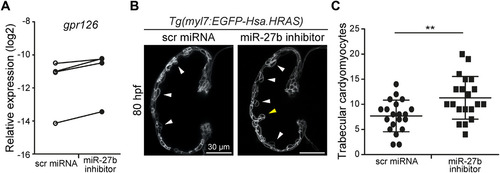
Modulation of gpr126 expression by miR‐27b inhibitor results in hypertrabeculation. (A) Expression of gpr126 at 80 hpf zebrafish embryos injected with miR‐27b inhibitor at a single cell stage in comparison with scr miRNA controls. White circles represent scr miRNA–injected and black circles represent miR‐27b inhibitor–injected embryos of four different clutches. Expression was quantified by qPCR and shown as normalized to a log2 scale. n = 4; P ≤ 0.05. (B) Representative images of zebrafish embryonic heart ventricles scr miRNA– and miR‐27b inhibitor–injected Tg(myl7:EGFP‐Hsa.HRAS) embryos at 80 hpf. White arrowheads indicate trabeculae. Yellow arrowhead indicates trabeculae, which are more complex than in control‐injected embryos at 80 hpf. (C) Scatter plot graph showing the number of trabecular cardiomyocytes in scr miRNA– and miR‐27b inhibitor–injected zebrafish embryos at 80 hpf. Trabecular cardiomyocytes were counted in 20 embryos of four clutches for each condition. Data are mean ± SD; n = 4; ** P ≤ 0.01. |