
|
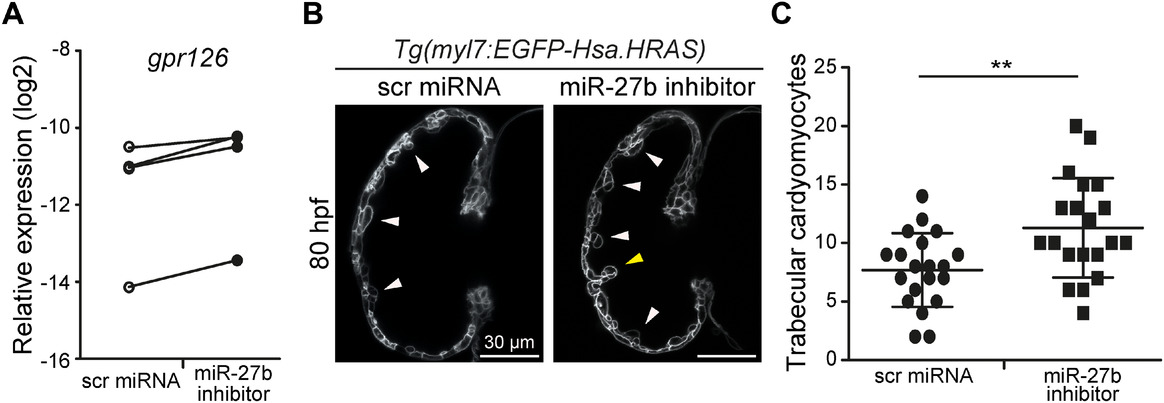
Fig. 5
Modulation of gpr126 expression by miR‐27b inhibitor results in hypertrabeculation. (A) Expression of gpr126 at 80 hpf zebrafish embryos injected with miR‐27b inhibitor at a single cell stage in comparison with scr miRNA controls. White circles represent scr miRNA–injected and black circles represent miR‐27b inhibitor–injected embryos of four different clutches. Expression was quantified by qPCR and shown as normalized to a log2 scale. n = 4; P ≤ 0.05. (B) Representative images of zebrafish embryonic heart ventricles scr miRNA– and miR‐27b inhibitor–injected Tg(myl7:EGFP‐Hsa.HRAS) embryos at 80 hpf. White arrowheads indicate trabeculae. Yellow arrowhead indicates trabeculae, which are more complex than in control‐injected embryos at 80 hpf. (C) Scatter plot graph showing the number of trabecular cardiomyocytes in scr miRNA– and miR‐27b inhibitor–injected zebrafish embryos at 80 hpf. Trabecular cardiomyocytes were counted in 20 embryos of four clutches for each condition. Data are mean ± SD; n = 4; ** P ≤ 0.01.