FIGURE SUMMARY
Title

Identification and Characterization of a Novel Protein ASP-3 Purified from Arca subcrenata and Its Antitumor Mechanism

Authors
Guo, Z., Shi, H., Li, C., Luo, Y., Bi, S., Yu, R., Wang, H., Liu, W., Zhu, J., Huang, W., Song, L.
Source
Full text @ Mar. Drugs

Isolation, purity, and molecular mass analysis of ASP-3. (A) Separation of proteins by diethyl-aminoethanol (DEAE)-sepharose fast flow anion exchange chromatography; (B) purification of the protein fraction by phenyl sepharose CL-4B hydrophobic chromatography (the blue arrow); (C) molecular mass analysis of ASP-3 by SDS-PAGE (the red box); and (D) RP-HPLC profile of ASP-3.

UV–Vis spectrum of ASP-3.

FTIR spectrum of ASP-3.

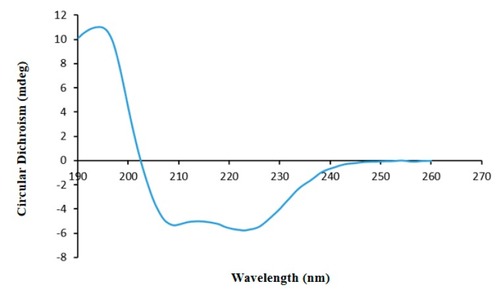
Secondary structure determination of ASP-3 by CD spectrum.

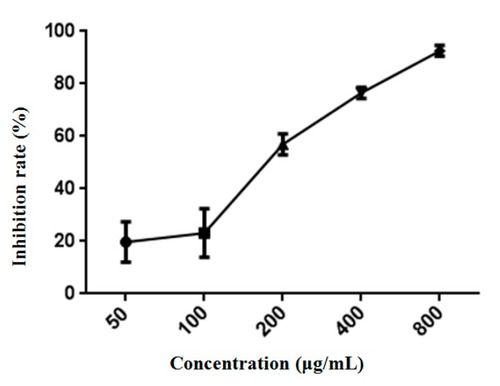
Antiproliferative activity of ASP-3 against HepG2 cells.

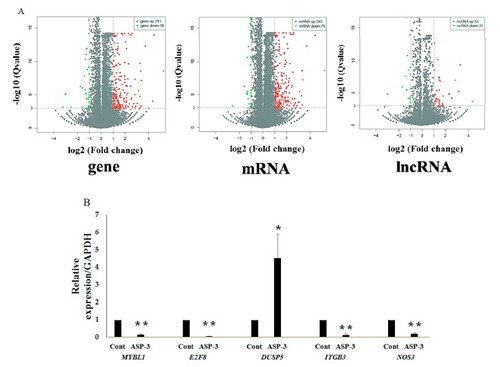
ASP-3 induced the changes in tumor-related gene expression of HepG2 cells. (A) Distributions of DEGs by volcano diagram; (B) tumor-related gene expression by qRT-PCR. * p < 0.05 versus control; ** p < 0.01 versus control.

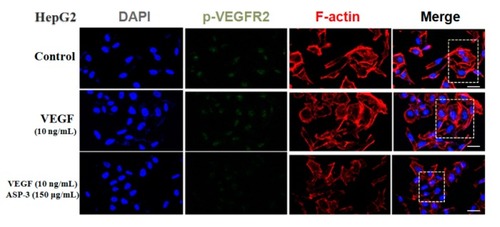
ASP-3 reduced VEGFR2 phosphorylation in HepG2 cells. Immunofluorescence staining was used to evaluate the distribution of VEGFR2 phosphorylation. They were stained with DAPI (blue), fluorescent secondary antibody of phospho-VEGFR2 VEGFR2 (green), and phalloidin (red), respectively. The immunofluorescence profile was visualized under a confocal fluoresce (scale bar: 20 µm).

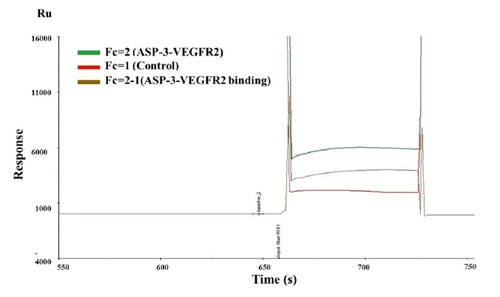
ASP-3 (100 nM) interacted with VEGFR2 based on SPR platform Biacore S200.

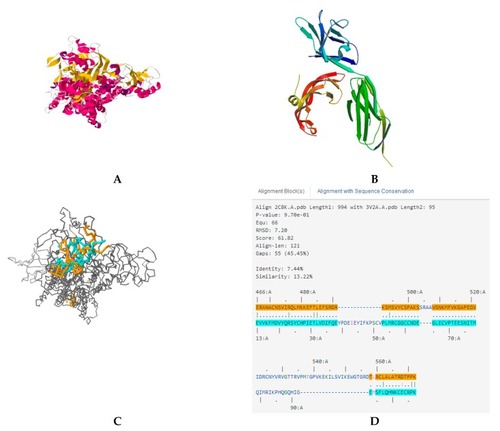
The predicted docking model and diagrams of ASP-3 and VEGF/VEGFR2. (A) The predicted structure of ASP-3. (B) The structure of VEGFA/VEGFR2. (C) The functions of ASP-3 and VEGFA/VEGFR2 (orange and blue). (D) Amino acid sequence alignment of ASP-3 and VEGFA/VEGFR2.

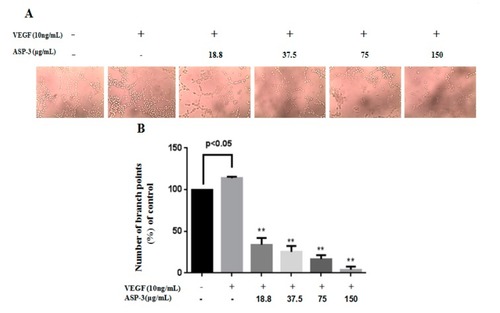
ASP-3 inhibits VEGF-induced tube formation of HUVECs in vitro. (A) Representative tubular structure images of HUVECs treated with different concentration of ASP-3 and VEGF (10 ng/mL, magnification 10×). (B) Number of branch points in HUVECs measured. p < 0.05 versus blank control; ** p < 0.01 versus VEGF-treated group.

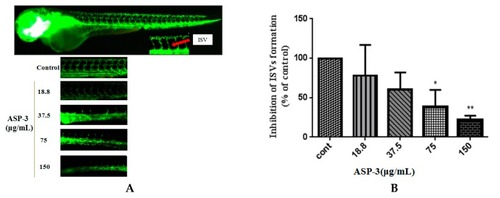
Anti-angiogenesis activity of ASP-3 in transgenic zebrafish model. (A) Lateral view of fli1a zebrafish embryos at 72 hpf. Live fluorescence microscopy highlights GFP expressing ISVs treated with ASP-3 in the concentration of 0–150 ug/mL (magnification: 4× and 10×). (B) The area of ISVs of zebrafish. (n = 6 for each experimental group). * p < 0.05; ** p < 0.01 versus control.

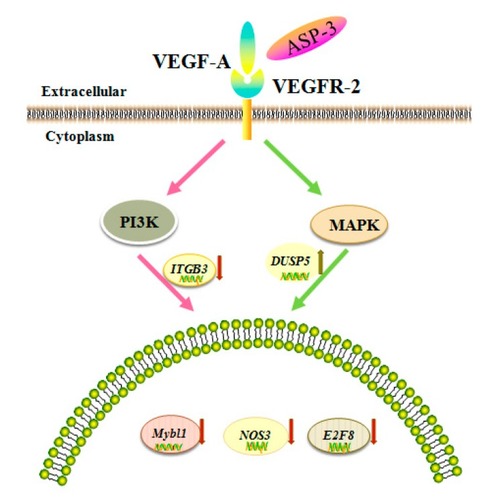
Proposed mechanism of antitumor effect of ASP-3.

Acknowledgments
This image is the copyrighted work of the attributed author or publisher, and ZFIN has permission only to display this image to its users. Additional permissions should be obtained from the applicable author or publisher of the image. Full text @ Mar. Drugs