
- Title
-
Optimization-by-design of hepatotropic lipid nanoparticles targeting the sodium-taurocholate cotransporting polypeptide
- Authors
- Witzigmann, D., Uhl, P., Sieber, S., Kaufman, C., Einfalt, T., Schöneweis, K., Grossen, P., Buck, J., Ni, Y., Schenk, S.H., Hussner, J., Meyer Zu Schwabedissen, H.E., Québatte, G., Mier, W., Urban, S., Huwyler, J.
- Source
- Full text @ Elife
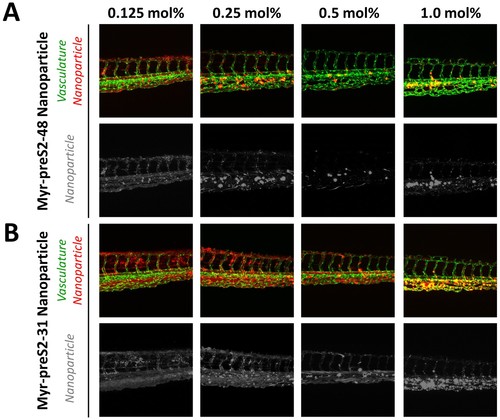
Systemic circulation of Myrcludex B-derived lipopeptide conjugated nanoparticles in vivo in the zebrafish model.Nanoparticles were modified with different amounts of (A) Myr-preS2-48 or (B) short Myr-preS2-31 and injected into transgenic zebrafish embryos expressing green fluorescent protein in their vasculature endothelial cells (green signal). Membrane of nanoparticles was fluorescently labeled using DiI (red signal). Representative confocal laser scanning microscopy images of tail region 1 hpost injection. |
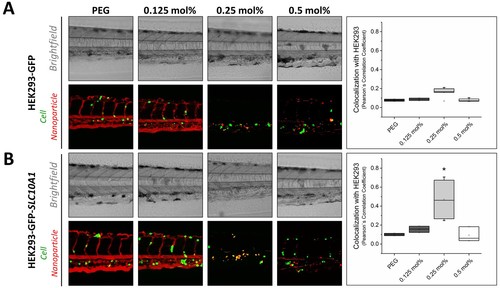
Targeting ability of Myr-preS2-31 conjugated nanoparticles in vivo in xenotransplanted zebrafish embryos.Nanoparticles were modified with different amounts of Myr-preS2-31 and injected into wild type zebrafish embryos xenotransplanted with human, GFP expressing HEK293 cells (green signal), (A) deficient or (B) expressing SLC10A1. Membrane of nanoparticles was fluorescently labeled using DiI (red signal). Yellow signals demonstrate colocalization (i.e. binding and internalization) of nanoparticles with HEK293-GFP cells. Representative brightfield and fluorescence images of tail region 1 h post injection are shown. Quantitative analysis of nanoparticle binding to HEK293-GFP cells is represented by Pearson´s Correlation Coefficient (PCC). All values are shown as box plots of biological replicates (n ≥ 2 independent experiments). *p<0.05. Numerical data for all graphs are shown in Figure 4—source data 1. |
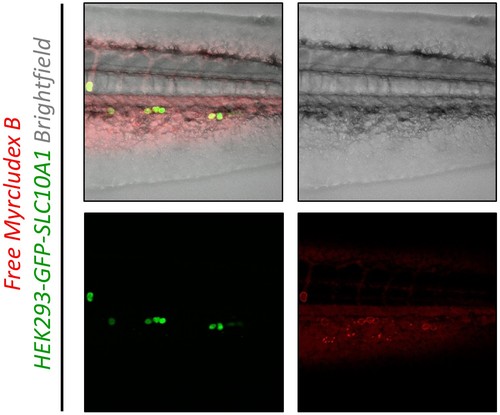
Targeting ability of free Myrcludex B in vivo in xenotransplanted zebrafish embryos.Atto-565 labeled Myrcludex B (red signal) was injected into wild type zebrafish embryos xenotransplanted with human HEK293 cells expressing SLC10A1 (GFP, green signal). Red signals on surface of HEK293 cells demonstrate binding of Myrcludex B. Representative brightfield and fluorescence images of tail region including a merge image 1 h post injection are shown. |