
- Title
-
JUNB governs a feed-forward network of TGFβ signaling that aggravates breast cancer invasion
- Authors
- Sundqvist, A., Morikawa, M., Ren, J., Vasilaki, E., Kawasaki, N., Kobayashi, M., Koinuma, D., Aburatani, H., Miyazono, K., Heldin, C.H., van Dam, H., Ten Dijke, P.
- Source
- Full text @ Nucleic Acids Res.
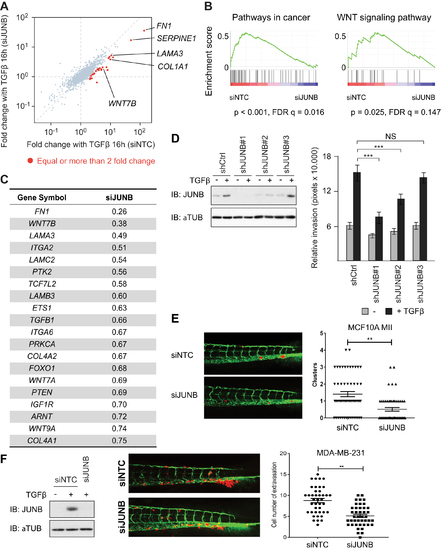
A JUNB-mediated feed-forward mechanism regulates genes associated with cell adhesion, invasion and controls invasion in a zebrafish model. (A) Scatter plot representing fold change after TGFβ (5 ng/ml) treatment. Each point represents values of a gene. Genes whose induction after 16 h TGFβ (5 ng/ml) treatment was attenuated more than 50% with siJUNB treatment are colored red. (B) GSEA of expression changes of SMAD2/3 target genes after manipulation of JUNB expression. The SMAD2/3 target genes were pre-rank-ordered according to their fold change (log2) between siNTC and siJUNB, and analyzed based on KEGG signaling pathway enrichment. Gene sets with P-value < 5% and FDR q-value < 25% were considered significant. Enrichment score (ES) is plotted on the y axis. (C) A list of core-enriched genes of the pathway ‘Pathways in cancer’, which contribute most to the enrichment score of the pathway. (D) Stable knock-down of JUNB in MCF10A MII cells with three distinct shJUNB expressing lentiviral vectors. Whereas #1 is efficient, #3 does not inhibit JUNB expression. Left: Western blot analysis. Right: collagen invasion of MCF10A MII spheroids stably expressing the sh control (Ctrl) or three distinct shJUNB lentiviral constructs. Spheroids were embedded in collagen in the absence or presence of TGFβ (5 ng/ml) as indicated. Relative invasion was quantified as the mean area that the spheroids occupied 36 h after being embedded in collagen. Data represent means ± SD (n ≥ 6 spheroids per condition) and are representative of three independent experiments; ***P < 0.001. (E and F) MCF10A MII (E) or MDA-MB-231 (F) mCherry cells transfected with non-targeting control (siNTC) or specific JUNB siRNA (siJUNB) were injected into the ducts of Cuvier (DoC) of 48 h post-fertilization (hpf) zebrafish embryos. Left: representative images of zebrafish at 6 days post-injection (dpi). Right: quantification of invasive cell cluster numbers in non-targeting and JUNB knock-down cells injected zebrafish larvae. (F) Most left, western blot control of knock-down efficiency. |
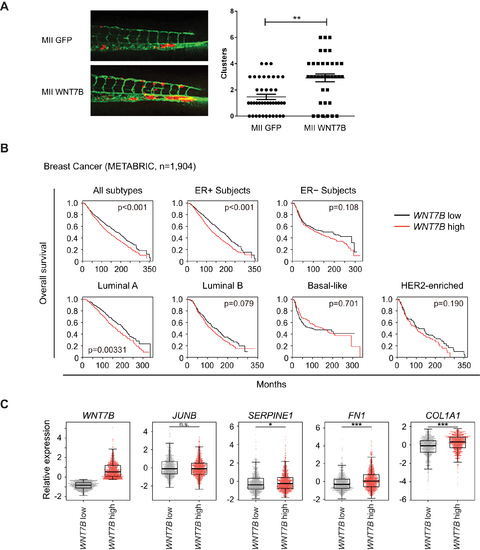
WNT7B promotes breast cancer cell invasion. (A) MCF10A MII mCherry stably expressing control GFP (MII GFP) or ectopic WNT7B-MYC (MII WNT7B) were injected into the DoC of 48-hpf zebrafish embryos. Left: representative images of zebrafish at 6 days post-injection (dpi). Right: quantification of invasive cell cluster numbers in GFP or WNT7B-MYC expressing MCF10A MII cells injected zebrafish larvae. (B) Kaplan-Meyer analysis of overall survival of breast cancer datasets from Molecular Taxonomy of Breast Cancer International Consortium (METABRIC) (40); all subtypes, n = 1904; ER+ subjects, n = 1445; ER− subjects, n = 429; luminal A subtype, n = 679; luminal B subtype, n = 461; HER2- subtype, n = 220; basal-like subtype, n = 199). Survival analysis was performed using a log-rank test. (C) Z-scored expression values of mRNA were obtained with cBioPortal (42,43). (***P < 0.001; n.s. not significant, Welch's t-test). |