FIGURE SUMMARY
Title

Nitrogen deprivation induces triacylglycerol accumulation, drug tolerance and hypervirulence in mycobacteria

Authors
Santucci, P., Johansen, M.D., Point, V., Poncin, I., Viljoen, A., Cavalier, J.F., Kremer, L., Canaan, S.
Source
Full text @ Sci. Rep.

Nitrogen limitation induces hypervirulence in M. abscessus. (A) Simplified diagram of the experimental workflow used to induce lipid-loaded M. abscessus by nitrogen deprivation prior to infection of zebrafish embryos. Zebrafish embryos were infected via caudal vein injection at 30 hpf with approximately 200 CFU of M. abscessus S or R cultured for 48 h in either 7H9 or MSM NL Gly 1%. (B) Nitrogen limitation results in significantly earlier mortality in M. abscessus R-infected zebrafish. Zebrafish embryo survival was monitored daily over a 12-day period following infection. Each group consisted of approximately 20 embryos, with each curve reproduced in triplicate. Statistical analysis was completed using the Mantel-Cox log-rank test. (C) Representative images displaying significantly increased pathology phenotypes at 6 dpi in zebrafish embryos infected with the M. abscessus R morphotype following nitrogen limitation. Transgenic reporter line zebrafish embryos harbouring fluorescent macrophages (mpeg:mCherry) (red overlay) were infected with M. abscessus harbouring pTEC15::mWasabi (green overlay) and the merge was observed in yellow. The open arrow (top) displays an intact abscess, while the closed arrow (bottom) displays a ruptured abscess. Scale bars represent 500 µm. **p-value ≤ 0.01.

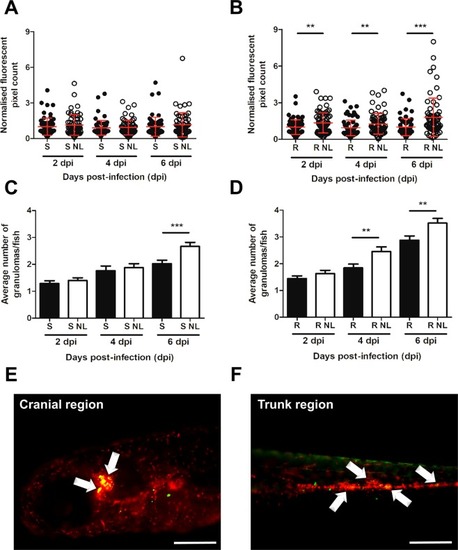
Nitrogen limitation results in increased bacterial burden and granuloma abundance. Transgenic zebrafish embryos harbouring red fluorescent macrophages (mpeg1:mCherry) were infected with approximately 200 CFU of M. abscessus S or R (producing mWasabi fluorescent protein) cultured in either 7H9 or in MSM NL Gly 1% and were imaged at 2, 4 and 6 dpi to quantify bacterial burden and granuloma number. (A,B) Bacterial burden was quantified using ImageJ ‘Analyse Particles’ function to determine fluorescent pixel counts. Error bars represent standard deviation, with each data point representing a single embryo. Data shown represent a pool of three individual experiments with approximately 20 embryos per group. Statistical analysis was completed using a Student’s t-test. (C,D) Granuloma number was quantified manually following colocalization (yellow) of bacteria (green) and macrophage aggregates (red) using ImageJ. Error bars represent standard deviation. Data shown is the average of three individual experiments with approximately 20 embryos per group. Statistical analysis was done using a Student’s t-test. (E,F) Representative images of granuloma quantification following bacterial and macrophage colocalization in the cranial and trunk region at 6 dpi. White arrows highlight granuloma presence. Scale bars represent 200 µm. **p-value ≤ 0.01, ***p-value ≤ 0.001.

Acknowledgments
This image is the copyrighted work of the attributed author or publisher, and ZFIN has permission only to display this image to its users. Additional permissions should be obtained from the applicable author or publisher of the image. Full text @ Sci. Rep.