FIGURE SUMMARY
Title

Exploration of age-related mitochondrial dysfunction and the anti-aging effects of resveratrol in zebrafish retina

Authors
Wang, N., Luo, Z., Jin, M., Sheng, W., Wang, H.T., Long, X., Wu, Y., Hu, P., Xu, H., Zhang, X.
Source
Full text @ Aging (Albany NY)

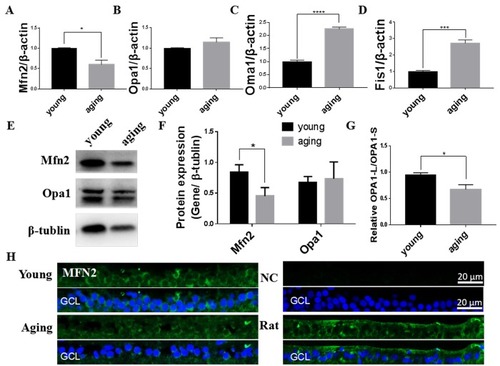
Mitochondrial fusion/fission imbalanced in aging zebrafish retinas. (A-D) Mfn2, Opa1, Oma1, and Fis1 expression in young and aging zebrafish retinas. Graphs represent (A) Mfn2, (B) Opa1, (C) Oma1, and (D) Fis1 gene expression by quantitative real-time PCR (mean ± SEM, *P<0.05, ***P<0.001, ****P<0.0001, n=3. (E) Representative western blot showing the protein expression levels of Mfn2 and Opa1 in young and aging zebrafish retinas. (F) The graph depicts the densitometric mean and SEM normalized to the corresponding level of the loading control protein beta-tubulin (*P<0.05, n=3). (G) The ratio of Opa1-L/Opa1-S, as determined by densitometry of western blots as in E (*P<0.05, n=3. (H) Immunofluorescence localization and relative expression of Mfn2 in the RGC layer of young and aging zebrafish retina cross-sections. All photographs were taken at 40x magnification except rat sections were at 20x magnification. Young, 4-6 months old zebrafish; aging, 19-23 months old zebrafish; NC, negative control (no primary antibody); Rat, rat retina positive control; Opa1-L, Opa1 long segment; Opa1-S, Opa1 short segment; GCL, ganglion cell layer.

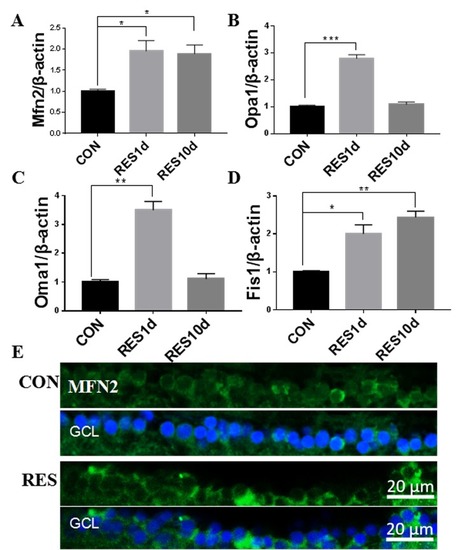
Resveratrol treatment increased mitochondrial fusion/fission expression in young zebrafish retina. (A-D) Mfn2, Opa1, Oma1, and Fis1 gene expression after resveratrol treatment for 1 or 10 days as determined by quantitative real-time PCR (mean ± SEM, *P<0.05, **P<0.01, ***P<0.001 compared to control (CON), n=3). (E) Immunofluorescence localization and relative expression of Mfn2 in the RGC layer of adult zebrafish retina cross-sections after 10 days resveratrol treatment. All photographs were taken at 40x magnification. CON, control; RES1d, resveratrol treated for 1 days; RES/RES10d, resveratrol treated for 10 days; GCL, ganglion cell layer.

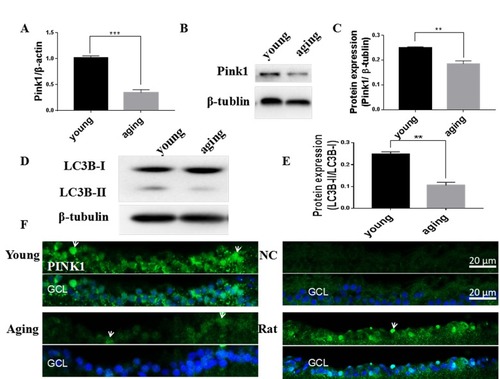
Decreased mitophagy and autophagy in aging zebrafish retinas. (A) Pink1 gene expression in young and aging zebrafish retinas as measured by quantitative real-time PCR (mean ± SEM, ***P<0.001, n=3). (B) Representative western blot showing the protein expression level of Pink1 in young and aging zebrafish retinas. (C) Graph of the densitometric mean and SEM normalized to the corresponding level of the loading control protein beta-tubulin (**P<0.01, n=3). (D) Representative western blot showing the protein expression levels of LC3B-II and LC3B-I in young and aging zebrafish retina. (E) Graph of the ratio of LC3B-II to LC3B-I protein levels as determined by densitometry (**P<0.01, n=3). (F) Immunofluorescence analysis of Pink1 in the RGC layer of young and aging zebrafish retinas. Retina cross sections prepared from zebrafish eyes were immunostained with Pink1 antibody. All photographs were taken at 40x magnification except the rat sections that were at 20x. Young, 4-6 months old; aging, 19-23 months old; NC, negative control (without primary antibody); Rat, positive control; GCL, ganglion cell layer.

Resveratrol treatment increased mitophagy in young zebrafish retina. (A) Pink1 gene expression in adult zebrafish retina after treatment with resveratrol for 1 and 10 days as measured by quantitative real-time PCR (mean ± SEM, *P<0.05 compared to control (CON), n=3). (B) Representative western blot showing the protein expression of Pink1 in adult zebrafish retina after treatment with resveratrol for 1 and 10 days. (C) Graph of the densitometric mean and SEM normalized to the corresponding level of the loading control protein beta-tubulin from western blots as in B (*P<0.05 compared to control (CON), n=3). (D) Immunofluorescence localization and relative expression of Pink1 in the RGC layer of adult zebrafish retinas after treatment with resveratrol for 10 days. Retina cross sections prepared from zebrafish eyes were immunostained with Pink1 antibody. All photographs were taken at 40x magnification. CON, control; RES1d, resveratrol treated for 1 days; RES/RES10d, resveratrol treated for 10 days; GCL, ganglion cell layer.

Activation of the Akt/mTOR pathway in aging zebrafish retinas. (A) Representative western blot showing the protein level of mTOR and p-mTOR in young and aging zebrafish retinas. (B) Densitometric mean and SEM normalized to the corresponding level of the loading control protein beta-actin (***P<0.001, n=3. (C) Representative western blot showing the protein expression level of Akt and p-Akt-T308 and p-Akt-S473 in young and aging zebrafish retinas. (D) Densitometric mean and SEM normalized to the corresponding level of the loading control protein beta-actin (*P<0.05, n=3. (E) Photographs of fluorescent immunostained retina cross-sections showing the localization and relative levels of p-mTOR and p-Akt-T308 in the RGC layers of young and aging zebrafish retinas. All photographs were taken at 40x magnification except rat sections were at 20x magnification and p-Akt-T308 at 60x magnification. Young, 4-6 months old zebrafish; Aging, 19-23-month-old zebrafish; Rat, positive control; GCL, ganglion cell layer.

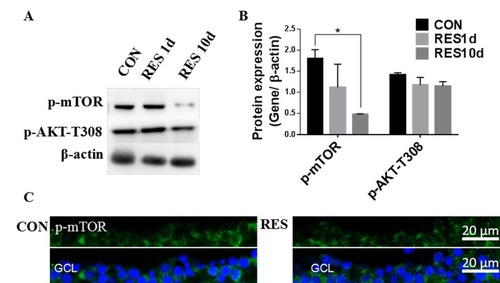
Resveratrol treatment suppressed the Akt/mTOR pathway in young zebrafish retinas. (A) Representative western blot showing the levels of p-mTOR and p-Akt-T308 in adult zebrafish retinas after being treated with resveratrol for 1 and 10 days. (B) Densitometric mean and SEM of p-mTOR and p-Akt-T308 normalized to the corresponding level of the loading control protein beta-actin (*P<0.05 compared to control (CON), n=3). (C) Photographs of fluorescence immunostained retina cross-sections showing the localization and relative levels of p-mTOR in the RGC layers of adult zebrafish retinas with or without resveratrol treatment for 10 days. All photographs were taken at 40x magnification. CON, control; RES1d, resveratrol treated for 1 days; RES/RES10d, resveratrol treated for 10 days; GCL, ganglion cell layer.

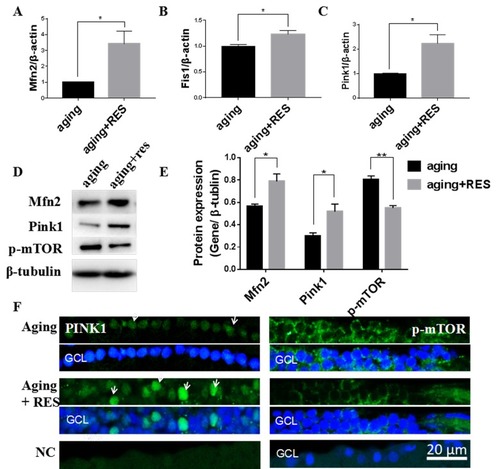
Resveratrol treatment activated Mfn2, Fis1, Pink1, and suppressed p-mTOR in aging zebrafish retina. (A-C) Mfn2, Fis1, Pink1 expression in aging and resveratrol-treated aging zebrafish retina. Graphs represent (A)Mfn2 (B) Fis1(C) Pink1 gene expression by quantitative real-time PCR (mean ± SEM, *P<0.05, n=3). (D)Representative western blot showing the protein expression levels of Mfn2,Pink1,p-mTOR in aging and resveratrol-treated aging zebrafish retina. (E)The graph showing the densitometric mean and SEM normalized to the corresponding level of the loading control protein beta-tubulin (*P<0.05, **P<0.01, n=3). (F) Immunolocalization and relative quantitative expression of Pink1 and p-mTOR on RGC in aging and resveratrol-treated aging zebrafish retina cross-sections. Retina cross sections prepared from zebrafish eyes were immunostained with Mfn2 or p-mTOR antibody. Results present aging, resveratrol-treated aging, and negative control (without primary antibody). All photographs were taken at 40 times. aging, 19-23 months zebrafish; aging + RES, resveratrol-treated aging zebrafish for 10 days; NC, negative control; GCL, ganglion cell layer.

Acknowledgments
This image is the copyrighted work of the attributed author or publisher, and ZFIN has permission only to display this image to its users. Additional permissions should be obtained from the applicable author or publisher of the image. Full text @ Aging (Albany NY)