
- Title
-
Ginsenoside F1 promotes angiogenesis by activating the IGF-1/IGF1R pathway
- Authors
- Zhang, J., Liu, M., Huang, M., Chen, M., Zhang, D., Luo, L., Ye, G., Deng, L., Peng, Y., Wu, X., Liu, G., Ye, W., Zhang, D.
- Source
- Full text @ Pharmacol. Res.
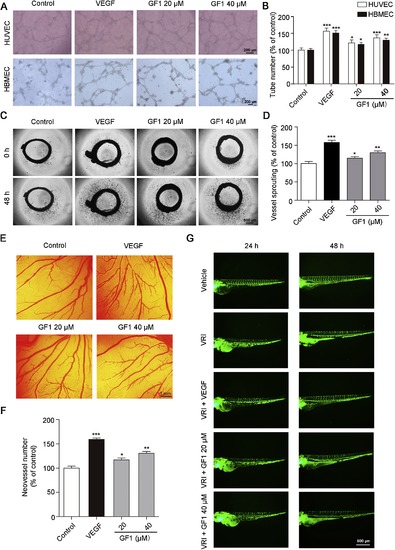
Ginsenoside F1 promoted angiogenesis in vitro, ex vivo and in vivo. (A–B) GF1 increased the tube formation capabilities of HUVECs and HBMECs. HUVECs or HBMECs were seeded in Matrigel-coated 96-well plates and treated with or without GF1 (20 and 40 μM) for 6 h. VEGF (80 ng/mL) served as the positive control. The endothelial tubes were observed and photographed. Quantification of the number of tubes is shown. (C–D) GF1 increased vessel sprouting in the rat aorta rings. Rat aortic rings were treated with or without GF1 (20 and 40 μM) for 48 h. VEGF (100 ng/mL) served as the positive control. Vessel sprouting was observed and photographed at 0 and 48 h. Quantification of the number of sprouting vessels is shown. (E–F) GF1 stimulated neovascularization in the CAM. Fertilized eggs were treated with or without GF1 (20 and 40 μM) for 48 h. VEGF (100 ng/mL) served as the positive control. The neovessels were observed and captured after 48 h. Quantification of the number of capillaries is shown. (G)GF1 rescued the VRI-induced vessel defect in zebrafish. Zebrafish were treated with VRI (axitinib, 1 μM) at 24 hpf for 6 h, followed by treatment with 0.1% DMSO (v/v), VEGF (200 ng/mL), or GF1 (20 and 40 μM) for 24 or 48 h. The ISVs were observed and photographed at 24 and 48 h. Representative images are shown; scale bars: 200 μm (A), 500 μm (C and G), and 1 mm (E). The data are presented as mean ± SEM (n = 3). *P < 0.05, **P < 0.01, and ***P < 0.001 compared with the control group. |
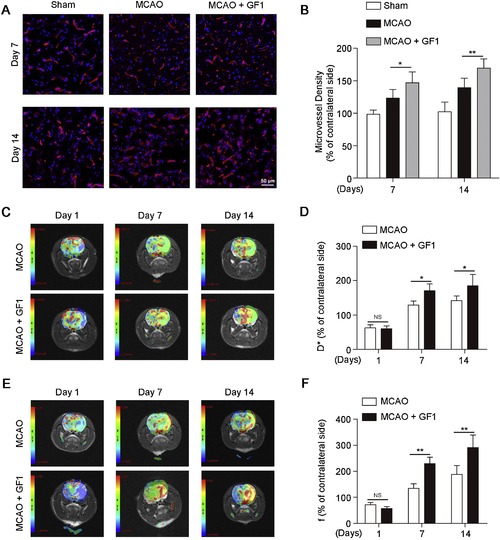
Ginsenoside F1 increased postischemic angiogenesis and improved focal cerebral blood perfusion in MCAO rats. (A–B) GF1 promoted postischemic angiogenesis and increased the MVD in the ipsilateral hemisphere of MCAO rats. At the 7th and 14th day after MCAO, the rats were anesthetized, transcardially perfused with 4% paraformaldehyde, and the whole brains were removed. Then, the 10 μm brain cryosections were stained with anti-CD31 and nucleus was stained with DAPI. Images of immunofluorescence staining were obtained and the quantification of the MVD is shown. GF1 markedly increased the relative D* (C–D) and f values (E–F) in the ipsilateral hemisphere at the 7th and 14th day after MCAO. Rats were received intragastrically administeratioin of GF1 (50 mg/kg) at 24 h after MCAO once daily for 14 days. All rats were anesthetized, and MRI scans were recorded at the 1st, 7th and 14th day after MCAO. The D* and f values were quantitatively calculated from the IVIM-DWI at the postprocessing workstation. Quantification of relative D* (D) and f values (F) and the corresponding parameter maps are shown. Representative images are shown; scale bar: 50 μm (A); NS represents no significance. The data are presented as mean ± SEM (n = 6). *P < 0.05 and **P < 0.01 compared with the MCAO group. |