In-cell ELISA assay to assess the ability of PTC124 to rescue the p.(Arg198*) and p.(Glu213*) variants in <italic>BMP4</italic> in 293T/17 cells.

Results of In-cell ELISA assay, demonstrating BMP4 protein levels for the p.(Arg198*) and p.(Glu213*) variants after incubation of 293T/17 cells for 48 hours with 20 μM PTC124, compared to untreated cells transfected with the same construct. An increase in BMP4 protein level was seen with p.(Arg198*), but this was not significant (p value = 0.09). There was minimal increase in the construct containing p.(Glu213*) after treatment with 10 μM PTC124 and 20 μM PTC124.

Ventroposterior and tail fin defects in <italic>bmp4</italic><sup><italic>st72/st72</italic></sup> homozygous larvae at 3 days post fertilization.

Representative examples of ventroposterior defects scored in bmp4st72/st72 homozygous larvae at 3 days post fertilization. The panels (Fig 2A–2D) show the tail fin (scale bars = 100 μm). Fig 2A shows a larva scored as an E phenotype (typical appearance with no defects), Fig 2B and 2C show larvae scored as a D phenotype (mild and moderate tail fin defects) and Fig 2D shows a larva scored as a C phenotype (moderate to severe tail fin defect). The sites of the tail fin defects are marked with arrows, except for Fig 2A, in which the arrows show a wildtype tail fin.

Results of phenotypic and genotypic analysis following treatment of in-crossed heterozygous <italic>bmp4</italic><sup><italic>st72/+</italic></sup> zebrafish with 0 μM, 1 μM and 2 μM PTC124.

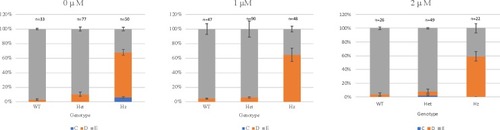
Larvae were not dechorionated and PTC124 treatment was started at 0 hours post fertilization (hpf). Analysis was performed at 72 hpf and the results are shown as the mean of 3 independent experiments, except for treatment with 2 μM PTC124, which is shown as the mean of 2 independent experiments. Larvae were scored as wildtype (E), mild reduction/deformity in ventral tail fin (D+ or D) or severe reduction/deformity in ventral tail fin (C). WT = wildtype, het = heterozygote, HZ = homozygote. Error bars show standard error of the mean. We tested for trend in the probability of tail fin defects across the increasing doses of 0 μM, 1.0 μM and 2.0 μM PTC124 treated, groups of homozygous larvae [24]. The probability of tail fin defect decreased from 68% to 64.58% and 59.09% as the dose increased to 1.0 μM and 2.0 μM. However, the trend failed to meet the statistical significance (p = 0.4681).

Phenotypic and genotypic analysis following treatment of incrossed heterozygous <italic>bmp4</italic><sup><italic>st72/+</italic></sup> zebrafish with 0 μM, 0.25 μM and 0.5 μM PTC124.

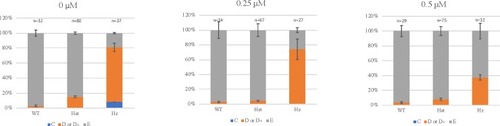
Larvae were dechorionated at 6–8 hours post fertilization (hpf) prior to starting PTC124 treatment. Analysis was performed at 72 hpf and the results are shown as the mean of 3 independent experiments. Larvae were scored as wildtype (E), mild reduction/deformity in ventral tail fin (D+ or D) or severe reduction/deformity in ventral tail fin (C). WT = wildtype, het = heterozygote, HZ = homozygote. Error bars show standard error of the mean. We tested for trend in the probability of tail fin defects across the increasing doses of 0 μM, 0.25 μM and 0.5 μM PTC124 treated, groups of homozygous larvae [24]. The probability of tail fin defect decreased from 81.08% to 74.07% and 37.50% as the dose increased to 0.25 μM and 0.5 μM. The decreasing trend was statistically significant (p = 0.0002).

Quantitative reverse transcriptase-polymerase chain reaction to assess <italic>bmp4</italic> expression.

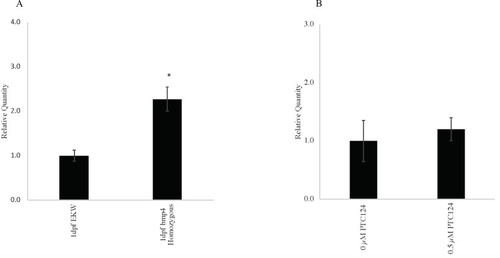
Fig 5A. Quantitative reverse transcriptase-polymerase chain reaction (qRT-PCR) showing bmp4 expression in untreated wildtype and bmp4st72/st72 homozygous larvae at 1 day post fertilization (dpf). RNA was extracted at 1 dpf from untreated, pooled wildtype EKW larvae and bmp4st72/st72 homozygous larvae. After cDNA synthesis, qRT-PCR was performed and analyzed using the ΔΔCt method and eef1a1l1 as an internal control gene. The results, plotted as relative quantity (RQ) normalized to bmp4 expression in wildtype EKW larvae at 1.0 show increased bmp4 expression in bmp4st72/st72 homozygous larvae (p = 0.014), consistent with bmp4 RNA available for rescue using nonsense suppression therapy. All values are an average of 3 replicates and 3 biological replicates were performed for each experiment. The error bars indicate the standard error (SE) of the mean. Fig 5B. Quantitative reverse transcriptase-polymerase chain reaction (qRT-PCR) showing bmp4 expression in incrossed bmp4st72/+ heterozygous larvae treated with 0 μM PTC124 and incrossed bmp4st72/+ heterozygous larvae treated with 0.5 μM PTC124 from 6–8 hours post fertilization (hpf). RNA was extracted at 3 days post fertilization (dpf) from pooled larvae treated with 0 μM PTC124 and larvae that had been treated with 0.5 μM PTC124 from 6–8 hpf. After cDNA synthesis, qRT-PCR was performed and analyzed using the ΔΔCt method and eef1a1l1 as an internal control gene. The results, plotted as relative quantity (RQ) normalized to bmp4 expression (1.0) in incrossed, bmp4st72/+ heterozygous larvae that were treated with 0 μM PTC124 show a non-significant increase in bmp4 expression in incrossed, bmp4st72/+ heterozygous larvae treated with 0.5 μM PTC124 (p = 0.09). All values are an average of 3 replicates and 3 biological replicates were performed for each experiment. The error bars indicate the standard error (SE) of the mean.

Acknowledgments
This image is the copyrighted work of the attributed author or publisher, and ZFIN has permission only to display this image to its users. Additional permissions should be obtained from the applicable author or publisher of the image. Full text @ PLoS One