
- Title
-
A mathematical model and iterative inversion for fluorescent optical projection tomography
- Authors
- Koljonen, V., Koskela, O., Montonen, T., Rezaei, A., Belay, B., Figueiras, E., Hyttinen, J., Pursiainen, S.
- Source
- Full text @ Phys. Med. Biol.

The head (top row) and the tail (bottom row) of the zebrafish embryo sample. (a) and (d) Show the bright field OPT projections, whereas (b)–(c) and (e) are fluorescent images. The bright regions in (b) and (c) correspond to high emitted intensity from the yolk sac of the embryo. Contrast in all images has been enhanced for print. The scalebar corresponds to |


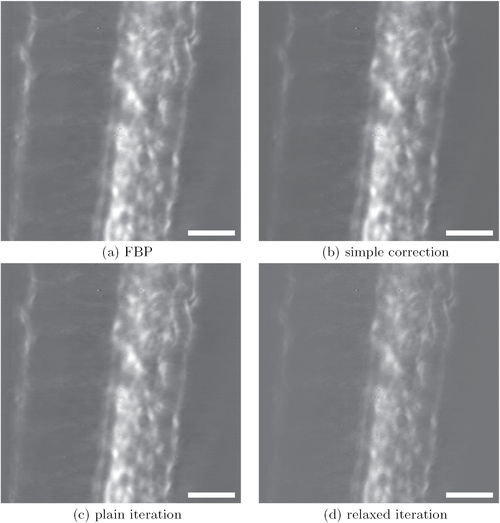
The coronal plane of the zebrafish tail reconstructions done using the methods stated above. The image saturation upper bound has been decreased to 67% of the maximum intensity of each image to highlight low-intensity details. The scalebar corresponds to
|


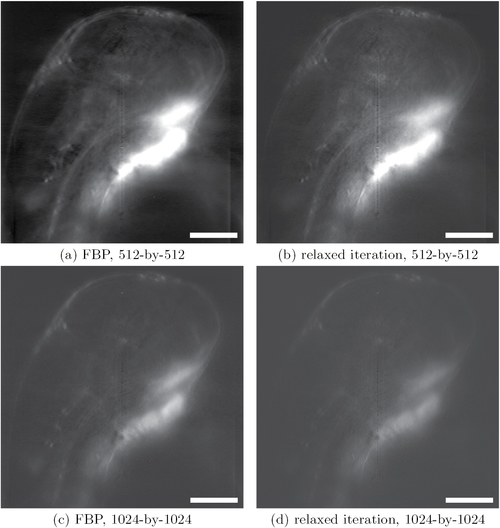
The coronal plane of the zebrafish head reconstructions at different resolutions done using the FBP and the relaxed iteration. The image saturation upper bound has been decreased to
|


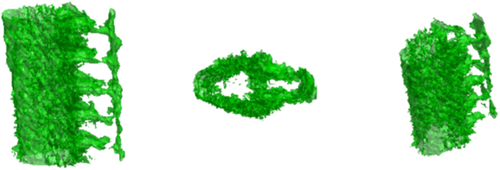
A frame from the isosurface video provided as supplementary material. The zebrafish embryo tail is reconstructed using the relaxed iteration and viewed from the side, the top and an oblique direction. The isosurface value in this frame is
|
