
Image
|
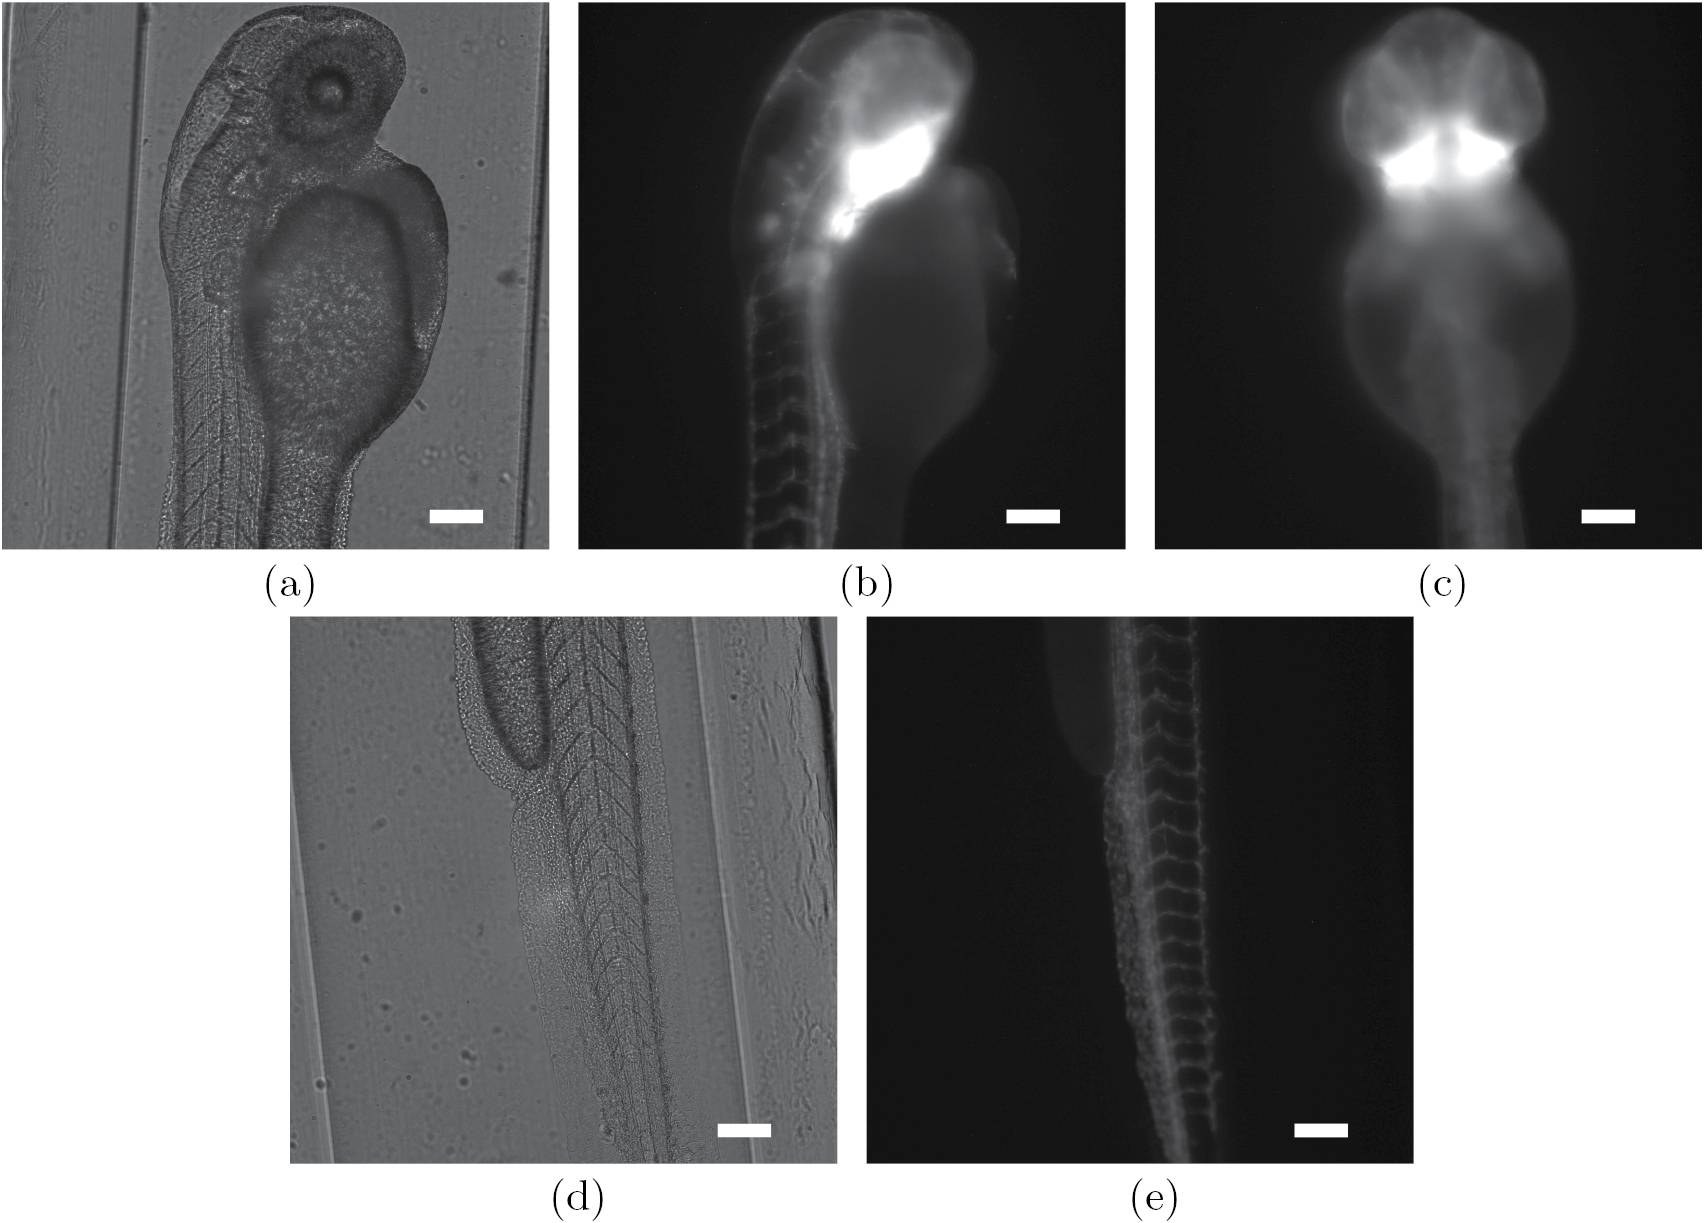
Figure Caption
Fig. 4
The head (top row) and the tail (bottom row) of the zebrafish embryo sample. (a) and (d) Show the bright field OPT projections, whereas (b)–(c) and (e) are fluorescent images. The bright regions in (b) and (c) correspond to high emitted intensity from the yolk sac of the embryo. Contrast in all images has been enhanced for print. The scalebar corresponds to 
 m.
m.
Acknowledgments
This image is the copyrighted work of the attributed author or publisher, and
ZFIN has permission only to display this image to its users.
Additional permissions should be obtained from the applicable author or publisher of the image.
Full text @ Phys. Med. Biol.