
- Title
-
Xiaoaiping Induces Developmental Toxicity in Zebrafish Embryos Through Activation of ER Stress, Apoptosis and the Wnt Pathway
- Authors
- Li, J., Zhang, Y., Liu, K., He, Q., Sun, C., Han, J., Han, L., Tian, Q.
- Source
- Full text @ Front Pharmacol

Phenotypes, mortality, and hatching rate of embryos following aqueous exposure to XAP from 24 to 120 hpf. (A) The phenotypes of embryos in the unexposed group and XAP exposure groups. (B) The mortality rate in zebrafish embryos exposed to XAP. (C) The hatching rate in zebrafish embryos exposed to XAP. ∗P < 0.05, ∗∗P < 0.01 versus control. |
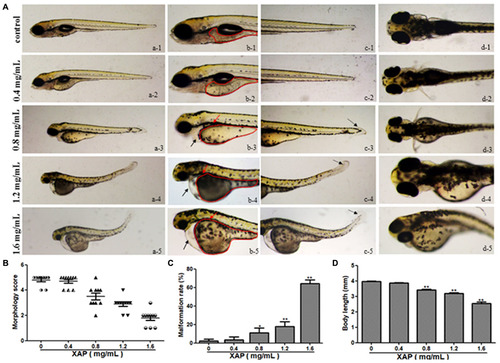
Body morphology effect of XAP exposure in zebrafish embryos at 120 hpe. (A) Representative lateral and ventral views of zebrafish larvae. Swim bladder deficiency is indicated by a solid red arrow. Yolk retention is indicated by the red outline. Pericardial edema is indicated by a solid black arrow. A slightly curved tail is indicated by a dotted black arrow. (B) Morphological scoring of XAP-exposed zebrafish embryos at 120 hpe. (C) Malformation rate of XAP-exposed zebrafish embryos at 120 hpe. (D) Body length of XAP-exposed zebrafish embryos at 120 hpe. ∗P < 0.05, ∗∗P < 0.01 versus control. |

Histopathological changes in the hearts, livers, intestines and muscles of zebrafish larvae exposed to XAP at 120 hpe. A thinner heart wall is indicated by a solid black arrow. Loose hepatocytes are indicated by a dotted black arrow. Frayed gut villi is indicated by a solid red arrow. Muscle atrophy is indicated by a dotted red arrow. |
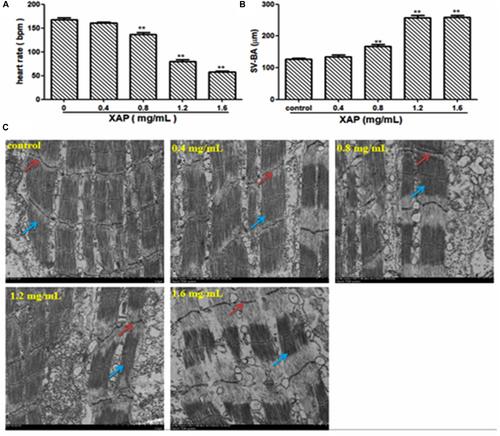
Heart toxicity effects of XAP in zebrafish embryos at 120 hpe. (A) The heart rate (beats/minute) in zebrafish larvae. (B) The SV-BA distance (μm) in zebrafish larvae. (C) The TEM image of zebrafish heart. Striated muscle is indicated by a solid red arrow, cardiac muscle fiber is indicated by a solid blue arrow. ∗P < 0.05, ∗∗P < 0.01 versus control. SV, sinus venous; BA, bulbus arteriosus; TEM, transmission electron microscope. |

Changes in ROS levels induced by XAP at 120 hpe. (A) ROS generation was identified as green fluorescence on a black background after XAP exposure. (B) The quantitative analysis of ROS generation after XAP exposure. (C) The change of T-SOD activity after XAP exposure. ∗P < 0.05, ∗∗P < 0.01 versus control. |