
Image
|
Figure Caption
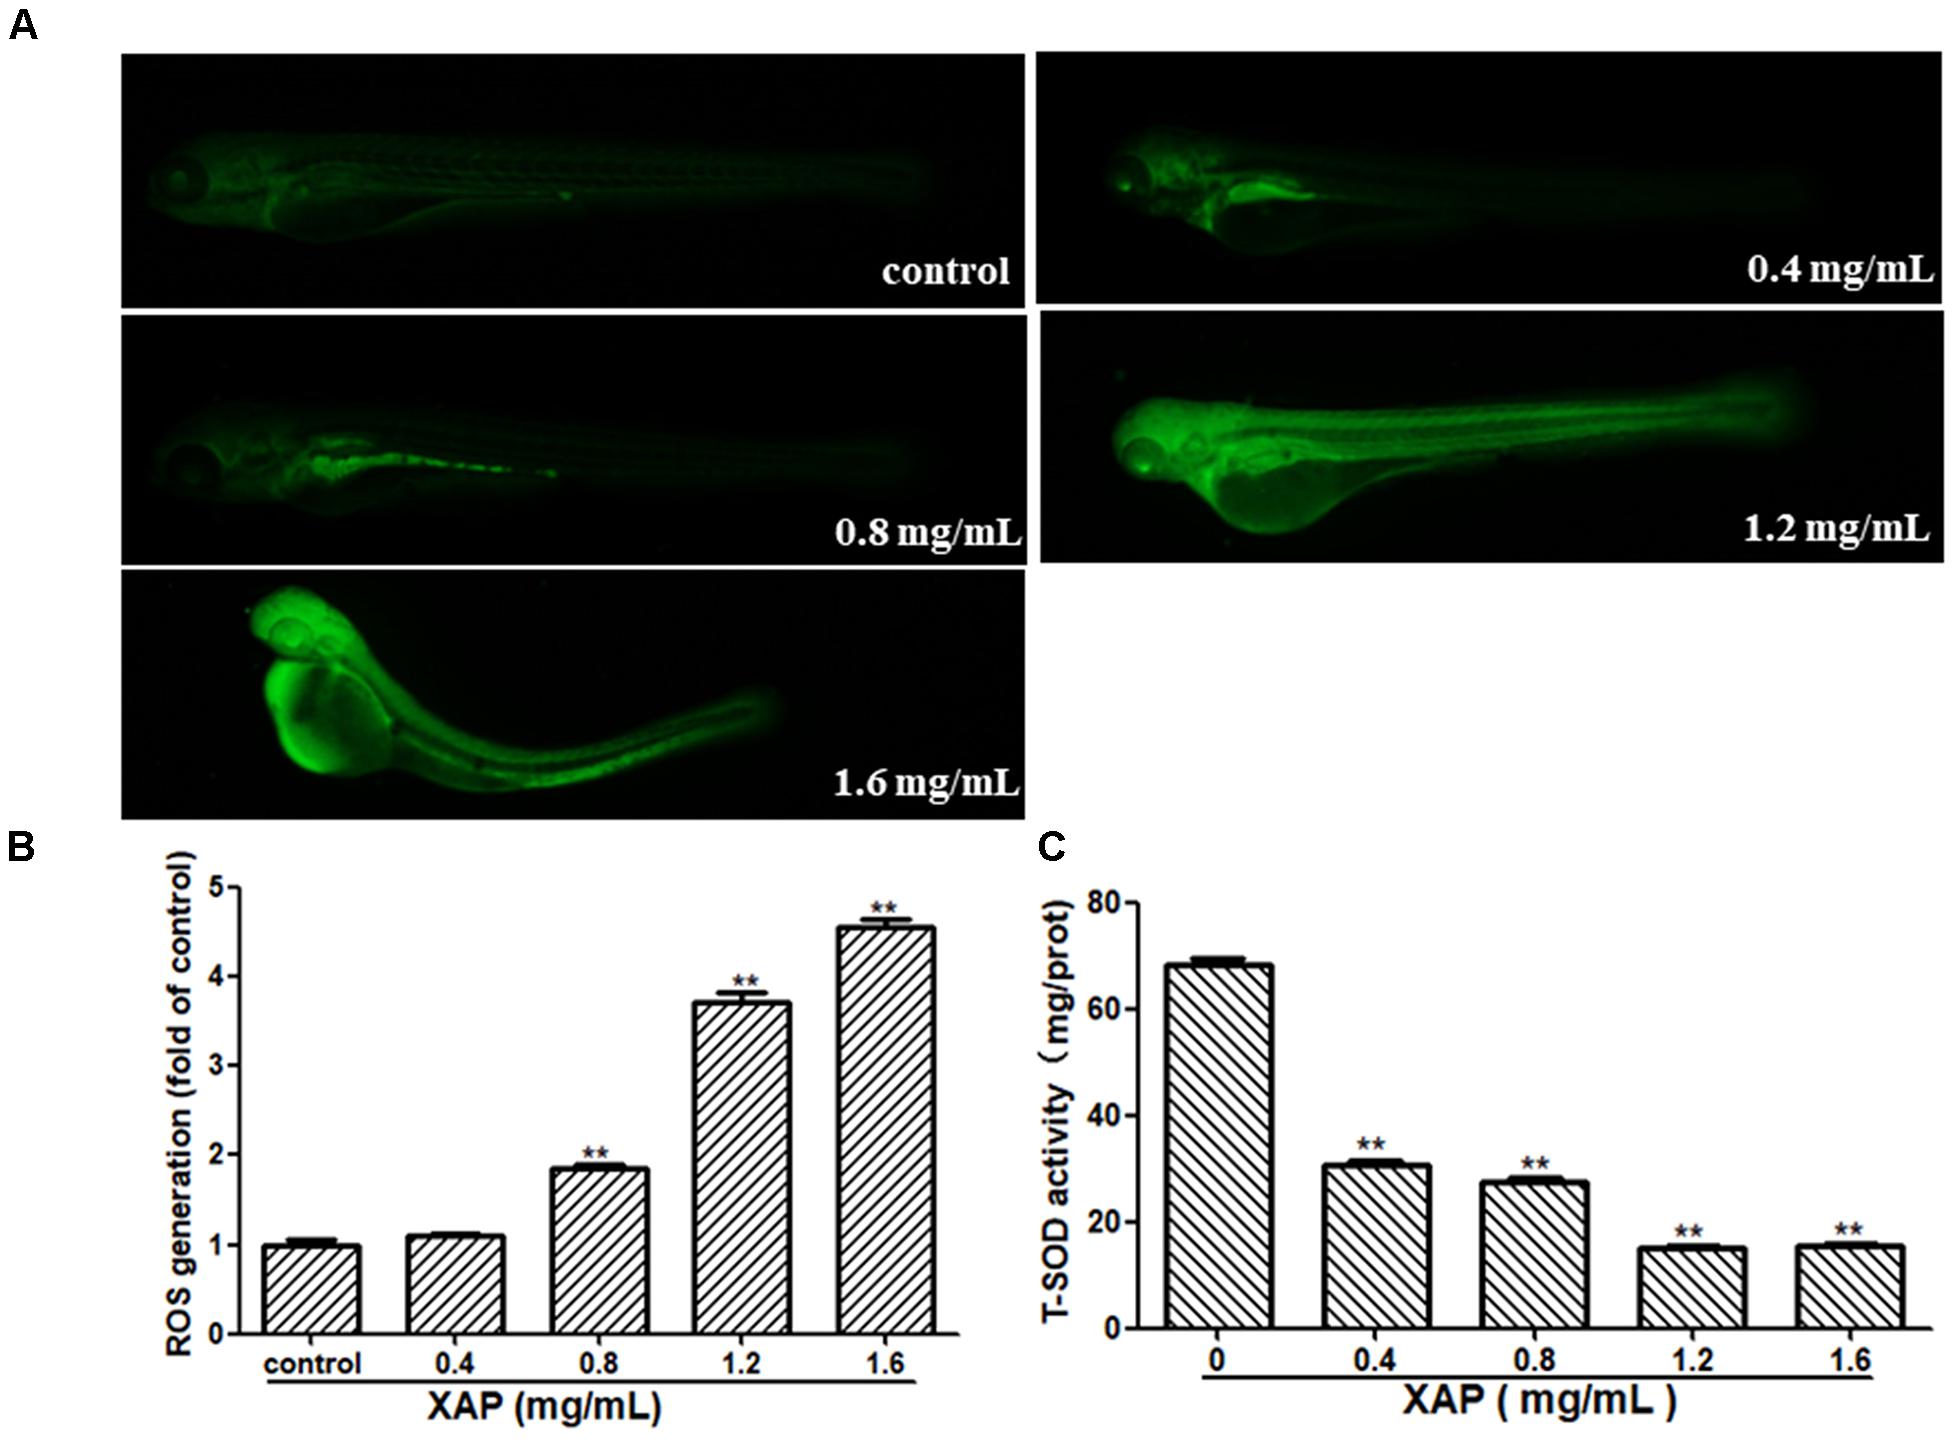
Fig. 6
Changes in ROS levels induced by XAP at 120 hpe. (A) ROS generation was identified as green fluorescence on a black background after XAP exposure. (B) The quantitative analysis of ROS generation after XAP exposure. (C) The change of T-SOD activity after XAP exposure. ∗P < 0.05, ∗∗P < 0.01 versus control.
Acknowledgments
This image is the copyrighted work of the attributed author or publisher, and
ZFIN has permission only to display this image to its users.
Additional permissions should be obtained from the applicable author or publisher of the image.
Full text @ Front Pharmacol