
- Title
-
Analyzing Neuronal Mitochondria in vivo Using Fluorescent Reporters in Zebrafish
- Authors
- Mandal, A., Pinter, K., Drerup, C.M.
- Source
- Full text @ Front Cell Dev Biol
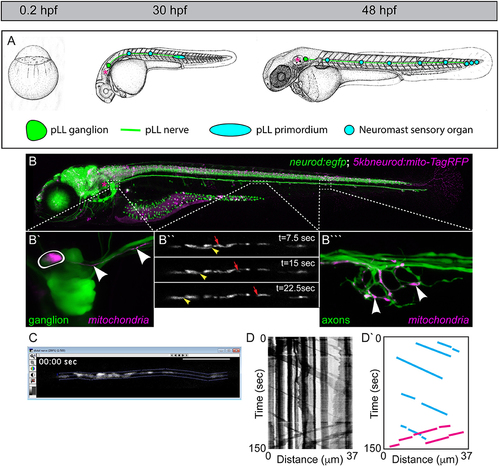
The zebrafish posterior lateral line (pLL): a circuit for addressing mitochondrial transport, health, and function. (A) The zebrafish develops rapidly from a single cell stage zygote to a hatched larvae by 48 h post-fertilization (hpf). During that time, the primary pLL also develops. Derived from a single ectodermal placode, the pLL primordium (blue oval) migrates from just behind the ear (asterisk) to the tip of the tail, completing its migration by 48 hpf. Along the way, the pLL primordium deposits approximately five nascent neuromasts which will develop into the sensory organs of the pLL. As it migrates, the pLL primordium guides the axons of the pLL nerve to the tail. The axons stretch from the pLL ganglion (green; contains pLL cell bodies) which remains behind the ear (asterisk) to the terminal cluster neuromasts in the tail in the longest of cases. Images modified from Kimmel et al. (1995). Permissions to use these images were obtained from the copyright holder, John Wiley & Sons, Inc. (B) By 5 days post-fertilization (dpf; bottom) the zebrafish larva is freely swimming and feeding. This image is of a live transgenic zebrafish larvae at 5 dpf which carries the stable TgBAC(neurod:egfp)nl1 transgene (hereafter referred to as neurod:egfp) that labels all pLL neurons with cytoplasmic green fluorescent protein (GFP). This larva is also a 5kbneurod:mito-TagRFP transient transgenic, which expresses mitochondrially-localized TagRFP (shown in magenta) in the mitochondrial inner membrane space in neurons. Transient transgenics are chimeras, with only a subset of neurons expressing this construct. (B′) Transient expression of mito-TagRFP in a single pLL ganglion neuron (outlined) and the axon extending from it (arrowheads). (B″) Mosaic expression allows imaging of a mitochondrial movement in a single axon of the pLL nerve. Yellow arrowhead points to a mitochondria moving in the retrograde direction. Red arrow indicates an anterogradely moving mitochondria (see Movie 1). (B‴ ) This single axon forms a basket-like axon terminal that innervates half of the hair cells in this neuromast. Arrowheads point to individual mitochondria in the terminal innervating sensory cells which are not shown. (C) Screenshot of an imaging analysis session in MetaMorph. The dotted lines outline the axonal region analyzed. (D) Kymograph of this imaging session. Mitochondrial movement is represented by the sloped black lines. Vertical lines show pauses in movement. (D′) Schematic of this kymograph with representative anterograde movement bouts (blue lines) and retrograde movement bouts (pink) traced. |
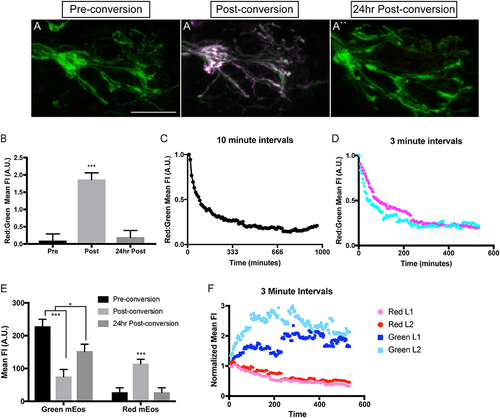
Analysis of mitochondrial lifetime in axons. (A) Expression of mitochondrially-localized mEos in the posterior lateral line of a 4 dpf 5kbneurod:mito-mEos transgenic larvae. For our analysis we used 5kbneurod:mito-mEos homozygotes to maximize mitochondria-localized mEos expression. This approach provides strong labeling of mitochondria in axon terminals. (A′) Illumination with 405 nm light converts mEos from green to red (shown in magenta). (A″) Twenty-four hours post-conversion, minimal converted (red) mEos remains in the axon terminal. (B) The relative converted to unconverted mito-mEos illustrates an almost complete loss of converted mitochondria from axon terminals by 24 h post-conversion (ANOVA with post-hoc contrasts; ***p < 0.0001; n = 15). (C,D) Time-lapse analysis of red to green mito-mEos in axon terminals after photoconversion shows a rapid turnover of mitochondria from the axon terminal, with most converted (red) mitochondria lost by 3 h post-conversion (n = 1 for C; n = 2 for D). (E) Quantification of the mean unconverted (green) and converted (red) mito-mEos in axon terminals shows both addition of new mitochondria and loss of converted mitochondria over a 24 h period (ANOVA with post-hoc contrasts; ***p < 0.0001; *p < 0.01; n = 15). (F) Time-lapse analysis of green and red mEos mean fluorescence intensity (normalized to post-conversion values) immediately after photoconversion in two larvae (L) demonstrates increased green and decreased red mEos over time. Timelapse data from two larvae normalized to post-conversion values. Scale bar = 10 μm. |