
|
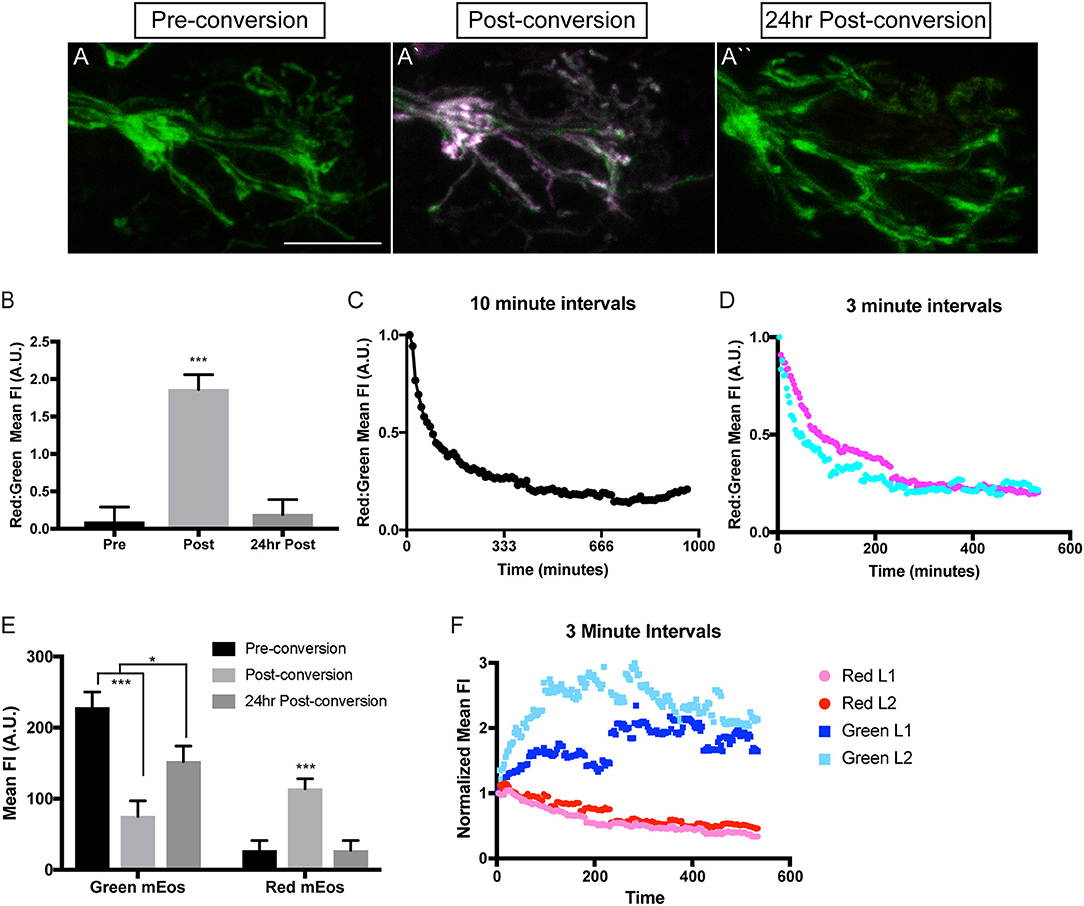
Fig. 3 Analysis of mitochondrial lifetime in axons. (A) Expression of mitochondrially-localized mEos in the posterior lateral line of a 4 dpf 5kbneurod:mito-mEos transgenic larvae. For our analysis we used 5kbneurod:mito-mEos homozygotes to maximize mitochondria-localized mEos expression. This approach provides strong labeling of mitochondria in axon terminals. (A′) Illumination with 405 nm light converts mEos from green to red (shown in magenta). (A″) Twenty-four hours post-conversion, minimal converted (red) mEos remains in the axon terminal. (B) The relative converted to unconverted mito-mEos illustrates an almost complete loss of converted mitochondria from axon terminals by 24 h post-conversion (ANOVA with post-hoc contrasts; ***p < 0.0001; n = 15). (C,D) Time-lapse analysis of red to green mito-mEos in axon terminals after photoconversion shows a rapid turnover of mitochondria from the axon terminal, with most converted (red) mitochondria lost by 3 h post-conversion (n = 1 for C; n = 2 for D). (E) Quantification of the mean unconverted (green) and converted (red) mito-mEos in axon terminals shows both addition of new mitochondria and loss of converted mitochondria over a 24 h period (ANOVA with post-hoc contrasts; ***p < 0.0001; *p < 0.01; n = 15). (F) Time-lapse analysis of green and red mEos mean fluorescence intensity (normalized to post-conversion values) immediately after photoconversion in two larvae (L) demonstrates increased green and decreased red mEos over time. Timelapse data from two larvae normalized to post-conversion values. Scale bar = 10 μm.