
- Title
-
Whole snake venoms: Cytotoxic, anti-metastatic and antiangiogenic properties
- Authors
- Kerkkamp, H., Bagowski, C., Kool, J., van Soolingen, B., Vonk, F., Vlecken, D.
- Source
- Full text @ Toxicon.

CPE titration after venom treatment. ZF-4 cells (left column) and PaTu 8988t cells (right column) were treated with O. hannah venom. The data shown here was obtained at 12 hours after addition of the venom. The cells representing the controls (photo A for ZF-4 and photo B for PaTu 8988t) form a confluent monolayer in which cells look similar to each other. In the lower concentrations of O. hannah venom, 0,2*10E-5 ng/ml culture medium, it can be observed that the shape of the PaTu 8988t cells (photo D) is different compared to the controls (photo B) as well as their size which has decreased. The ZF-4 cells (photo C) show at this low concentration little differences compared to the controls. In photo’s E and F the dose is increased to 0,002 ng/ml whereby the cells show less pronounced intracellular connections, which can be a first sign of detachment from each other and the substrate. When the dose of venom was increased to 20 ng/ml, massive cell death was observed in PaTu 8988t cells. These cells detached from the plate and are visible as small round floating spheres. These cells are irregular in size and some have fused resulting in multiple nuclei per cell. The ZF-4 cells showed cell death to a lesser extend at this high dose.When treated with O. hannah venom it can be observed that the shape of the primary embryonic chicken cells is different compared to the controls. The brain cells (Fig. 1s, photo B) that were exposed to the venom decreased in numbers and showed a significant increase in formation of stress fibers, whereas the kidney cells that were exposed showed EMT-like shape as is shown in the upper left section of picture D (Fig. 2s). These cells show an elongated shape compared to the controls. Liver cells show cell death and disintegration of membrane structures and intracellular connections, which presents itself as less pronounced boundaries between cells. Whereas the brain cells significantly decreased in numbers and integrity of the monolayer, the venom treated liver (Fig. 1s photo F) and kidney cells (Fig. 1s photo D) don’t show a significant number of dead cells. |
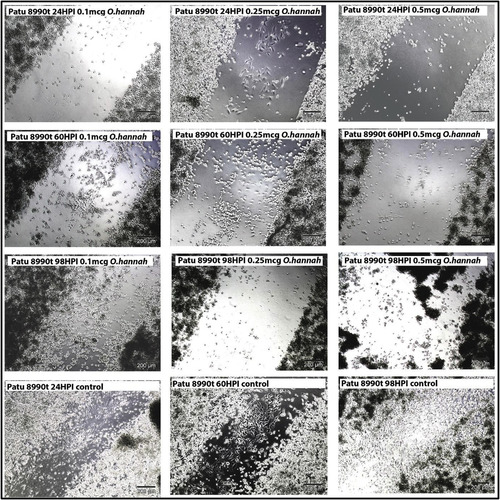
Cell migration of PaTu 8990t cells treated with venom of Ophiophagus hannah.Lyophilized O. hannah venom, dispersed in Hank’s buffer, was added to PaTu 8990t cells but not to the controls (shown in the bottom row). The control cells show 50% closure after 24 h and complete closure of the scratch at 98 h after adding the venom. Treated cells were incubated with 0.1 microgram venom (diluted at 10E-4), 0.25 microgram (diluted at 2.5 X10E-4) and 0.5 microgram (diluted at 5X10E-4). The cells were scored at three different times: 24 hours post initiation (24hpi), 60hpi and 98 hpi and the results in time are shown per row. |
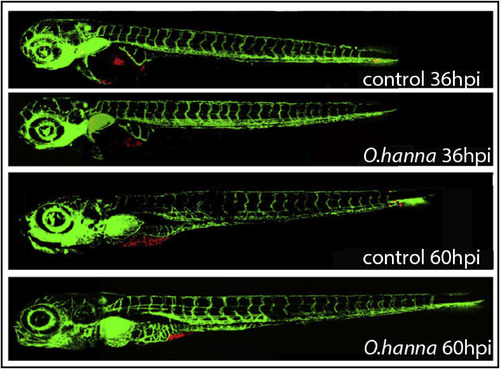
Anti-migration effects of O. hannah venom on zebrafish embryos with a pancreatic cancer cell graft containing PaTu 8988t cells. The two control photos show embryos with a transplanted cell mass of which cells have spread via the vasculature. |

Anti-angiogenic properties of O. hannah venom and E. Carinatus venom at 2 dpi. The figure shows three confocal micrographs of PaTu 8988t cells (red) transplanted into 48 hpf fli zebrafish embryos (green). The cells were dispersed in Matrigel, as a result of which they remain in the yolk sac. When O. hannah venom was added to the cells, inhibition of angiogenesis was observed. However, treatment of the fish with E. carinatus venom resulted in angiogenesis, like the controls. 20× magnification. (n = 20 embryos per tested snake venom). (For interpretation of the references to color in this figure legend, the reader is referred to the Web version of this article.) |