
FIGURE SUMMARY
- Title
-
Membrane Remodeling as a Key Player of the Hepatotoxicity Induced by Co-Exposure to Benzo[a]pyrene and Ethanol of Obese Zebrafish Larvae
- Authors
- Imran, M., Sergent, O., T�te, A., Gallais, I., Chevanne, M., Lagadic-Gossmann, D., Podechard, N.
- Source
- Full text @ Biomolecules
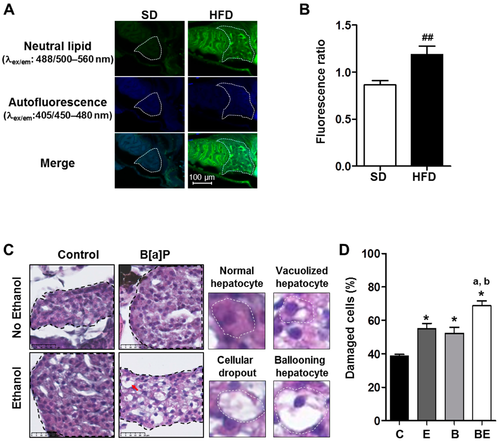
Progression of high-fat diet (HFD) induced steatosis in zebrafish larvae to a steatohepatitis-like state upon co-exposure to ethanol and benzo[a]pyrene. Zebrafish larvae were fed with a HFD from 4 days post-fertilization (dpf) until 5 dpf and compared to larvae fed with a standard diet (SD) in order to observe the development of steatosis at 5 dpf (A,B). Lipid accumulation was analyzed after Nile red staining in HFD larvae as well as in SD larvae using confocal microscopy (excitation/emission (ex/em) wavelength: 488/500?560 nm, magnification �400). (A) Representative images of larva staining are presented in which the liver has been outlined in white. (B) In order to estimate the relative amount of neutral lipids in the liver, the ratio of fluorescence intensity was calculated from images of more than 15 larvae per diet as follows: Fluorescence ratio = (intensity of neutral lipid staining with Nile red (ex/em wavelength: 488/500?560 nm)/(intensity of unspecific staining (autofluorescence; ex/em wavelength: 405/450?480 nm))). Values are the mean � standard error of the mean (SEM) of at least 12 larvae per diet. Zebrafish larvae fed with HFD from 4 dpf and exposed to ethanol and/or B[a]P for seven days from 5 to 12-dpf to achieve four conditions?untreated (C) or treated with 25 nM B[a]P (B), 43 mM ethanol (E) or a combination of both toxicants (BE,C,D). (C) Liver damage was evaluated on zebrafish liver sections after HES staining (magnification �400). Black dotted line outlines liver. Histological liver sections were magnified to show, surrounded by the white dotted line, a normal hepatocyte, a vacuolized hepatocyte, a cellular dropout and a ballooning hepatocyte (red arrow). Images are representative of at least five larvae. (D) From images obtained in (C), the histological count of damaged cells was realized. Values are the mean � SEM of at least five larvae. ## Significantly different from SD larvae; * Significantly different from HFD control larvae; a Significantly different from larvae treated by ethanol only; b Significantly different from larvae treated by B[a]P only.
|
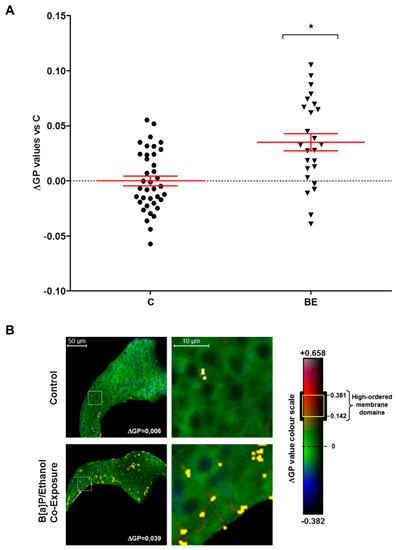
Co-exposure to alcohol and benzo[a]pyrene-induced membrane remodeling in the liver of HFD zebrafish larvae. Membrane order and lipid raft spatial distribution characteristics of membrane remodeling was assessed in liver cells of steatotic zebrafish larvae after co-exposure to ethanol and B[a]P for seven days from 5 to 12 dpf. Zebrafish larvae under two conditions?untreated (C) or treated with combination of 43 mM ethanol and 25 nM B[a]P (BE)?were stained with di-4-ANEPPDHQ?a membrane order-sensitive fluorescent probe?and analyzed by confocal fluorescence microscopy. Membrane order in membranes of zebrafish liver was measured by computing the generalized polarization (GP) factor. (A) Changes in GP values were expressed as the difference between individual larva GP value and the mean of GP found in control larvae (?GP). (B) On the left, some representative liver images of each treatment have been selected according to the respective mean of delta GP (magnification �400). Pixels with higher GP values (which could be considered as lipid rafts) have been highlighted in yellow to pinpoint lipid raft spatial distribution. The liver area outlined in the white square on the left images are magnified on the right side to show lipid raft spatial distribution in the plasma membrane. Values are the mean � standard error of the mean (SEM) of at least 25 larvae. * Significantly different from HFD control larvae.
PHENOTYPE:
|
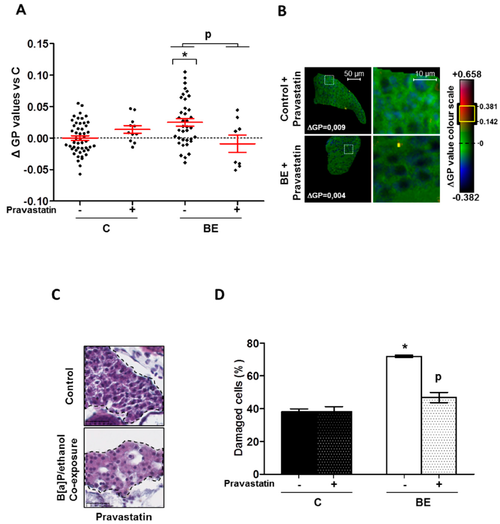
Protective effect of pravastatin towards membrane remodeling and hepatotoxicity-induced by B[a]P/ethanol in HFD zebrafish larvae. Membrane remodeling was assessed in the liver of HFD steatotic zebrafish larvae after exposure to ethanol and B[a]P for seven days with and without pravastatin (0.5 �M) from 5 to 12 dpf. Zebrafish larvae under four conditions, control (untreated (C) � Pravastatin), or treated with combination of both toxicants (BE � Pravastatin; 25 nM B[a]P and 43 mM ethanol) were stained with di-4-ANEPPDHQ?a membrane order-sensitive fluorescent probe?and analyzed on confocal fluorescence microscopy. Membrane order in membranes of zebrafish liver was measured by computing GP factor. (A) Changes in GP values were expressed as the difference between individual larva GP value and the mean of GP found in control larvae (?GP). Values are the mean � SEM of at least eight larvae. (B) On the left, some representative liver images of each treatment have been selected according to the respective mean of delta GP (magnification �400). Pixels with higher GP values (could be considered as lipid rafts) have been highlighted in yellow through membrane area of liver cells to pinpoint lipid raft spatial distribution. Liver area outlined in white square on left images are magnified on right side to show lipid raft spatial distribution in plasma membrane. (C) Liver damages were evaluated on zebrafish liver section after HES staining (magnification �400). Black dotted line outlines liver. Images are representative of at least 3 larvae. (D) From images obtained in (C), histological count of damaged cells was realized. Values are the mean � SEM of at least three larvae. * Significantly different from HFD control larvae; P Significant difference between larvae treated by pravastatin compared to untreated counterparts.
PHENOTYPE:
|
Acknowledgments
This image is the copyrighted work of the attributed author or publisher, and
ZFIN has permission only to display this image to its users.
Additional permissions should be obtained from the applicable author or publisher of the image.
Full text @ Biomolecules