
- Title
-
Multidimensional quantitative analysis of mRNA expression within intact vertebrate embryos
- Authors
- Trivedi, V., Choi, H.M.T., Fraser, S.E., Pierce, N.A.
- Source
- Full text @ Development

Accuracy and precision assessed by redundant detection. (A) Each target mRNA is detected using two probe sets, each initiating an orthogonal and spectrally distinct HCR amplifier (red channel, Alexa 647; green channel, Alexa 546). (B) Two-channel redundant detection of four target mRNAs: desma, Gt(desma-citrine) and elavl3 in whole-mount zebrafish embryos (fixed 26 hpf); and Acta2 in a whole-mount mouse embryo (fixed E9.5). Confocal microscopy: 0.7×0.7 µm pixels (desma, citrine and elavl3) or 0.07×0.07 µm pixels (Acta2). (C) Highly correlated normalized signal (Pearson correlation coefficient, r) for 2×2×2 µm voxels in the selected regions of B. Accuracy: linear with zero intercept. Precision: scatter around the line. (D) Scatter as a function of voxel size for desma. See section S2.1 in the supplementary material for control experiments testing for potential systematic penetration and crowding effects; see section S2.2 in the supplementary material for an examination of the effect of voxel size and probe set size on quantitative precision; and see section S2.3 in the supplementary material for additional data. |

Measuring a twofold difference in mRNA levels. (A) Two-channel imaging of citrine (red channel, Alexa 647) and desma (green channel, Alexa 546) target mRNAs in homozygous Gt(desma-citrine)ct122a/ct122a embryos and heterozygous Gt(desma-citrine)ct122a/+ embryos. Confocal microscopy: 0.7×0.7 µm pixels. Whole-mount zebrafish embryos fixed at 26 hpf. Depicted regions are analyzed in B-D. (B) Normalized signal for citrine (red) and desma (green) targets in homozygous and heterozygous embryos (mean±s.d. via uncertainty propagation, n=3 embryos). (C) Ratio of citrine target in homozygous versus heterozygous embryos (mean±s.d. via uncertainty propagation, n=3 embryos). (D) Normalized signal for 2×2×2 µm voxels within the selected regions of A. See section S2.4 in the supplementary material for additional data. |
Measuring a twofold difference in mRNA levels. (A) Two-channel imaging of citrine (red channel, Alexa 647) and desma (green channel, Alexa 546) target mRNAs in homozygous Gt(desma-citrine)ct122a/ct122a embryos and heterozygous Gt(desma-citrine)ct122a/+ embryos. Confocal microscopy: 0.7×0.7 µm pixels. Whole-mount zebrafish embryos fixed at 26 hpf. Depicted regions are analyzed in B-D. (B) Normalized signal for citrine (red) and desma (green) targets in homozygous and heterozygous embryos (mean±s.d. via uncertainty propagation, n=3 embryos). (C) Ratio of citrine target in homozygous versus heterozygous embryos (mean±s.d. via uncertainty propagation, n=3 embryos). (D) Normalized signal for 2×2×2 µm voxels within the selected regions of A. See section S2.4 in the supplementary material for additional data. |

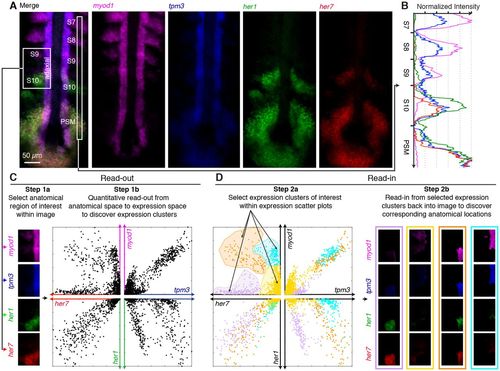
Quantitative snapshots of gene co-expression changes during somite formation and maturation. (A) Anatomical regions of interest within somites S7, S8, S9 and S10, and the presomitic mesoderm (PSM). (B) Expression scatter plots for four target mRNAs shaded by anatomical regions in A. (C) Subcircuit expression scatter plots. Amplitude of her1-her7 subcircuit |

