
- Title
-
Cloning, expression pattern and promoter functional analysis of cyp19a1a gene in miiuy croaker
- Authors
- Huang, W., Yang, P., Lv, Z., Wu, C., Gui, J., Lou, B.
- Source
- Full text @ Gene
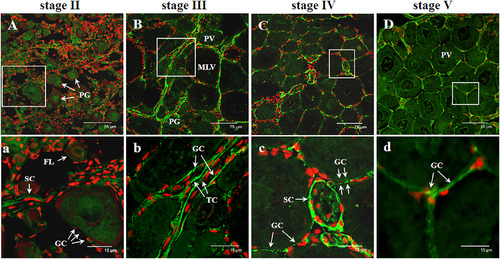
Immunofluorescence localization of Mmcyp19a1a protein in the ovary sections at different vitellogenesis stages. Green represents Mmcyp19a1a protein, while red represents the nucleus. (A) section of stage II. (B) section of stage III, (C) section of stage IV, (D) section of stage V. (a), (b), (c) and (d) show the corresponding amplification of (A), (B), (C) and (D). Arrowhead indicates the positive signal. FL, follicular layer; GC, granulosa cell; TC, thecal cell; SC, supporting cells of connective tissue; PG, primary growth oocytes; PV, previtellogenic oocyte; MLV, mid- to late-vitellogenic oocyte. (For interpretation of the references to color in this figure legend, the reader is referred to the web version of this article.) |
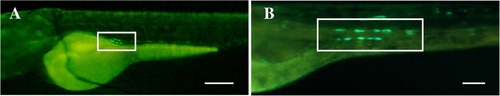
Expression of GFP in zebrafish embryos directed by Mmcyp19a1a promoter. A, the embryo at about 48 hpf; B, the embryo at about 72 hpf. Head of the embryo is to the left, specific GFP-expressing cells are indicated by white rectangles. |
Reprinted from Gene, 627, Huang, W., Yang, P., Lv, Z., Wu, C., Gui, J., Lou, B., Cloning, expression pattern and promoter functional analysis of cyp19a1a gene in miiuy croaker, 271-277, Copyright (2017) with permission from Elsevier. Full text @ Gene