- Title
-
Expression patterns of prune2 is regulated by Notch and retinoic acid signaling pathways in the zebrafish embryogenesis
- Authors
- Anuppalle, M., Maddirevula, S., Kumar, A., Huh, T.L., Choe, J., Rhee, M.
- Source
- Full text @ Gene Expr. Patterns
|
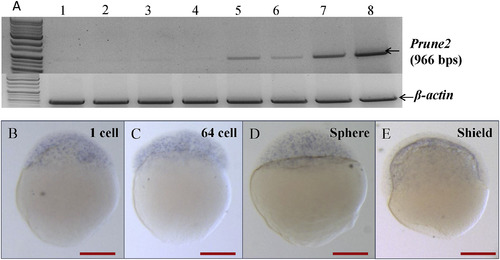
Spatio-temporal distribution of prune2 transcripts in early embryonic stages. (A) Analysis of prune2 transcripts by RT-PCR at different embryonic stages, 1-cell, sphere, shield, 10 hpf, 18 hpf, 24 hpf, 36 hpf, and 48 hpf. (B–E) Analysis of prune2 transcripts at 1 cell, 64 cell, sphere, and shield stage by WISH. prune2 maternal transcripts were found at low level in 1 cell stage while they were not notable till shield stage. B-E; dorsal views. All scale bars in red indicate 50 μm. |
|
WISH analysis for spatio-temporal patterns of prune2 transcripts during segmentation stages. (A) prune2 maternal transcripts were evident at 10 somites stage. (B–D) prune2 transcripts were expressed in the TC; telencephalon, SCN; spinal cord neurons,C; cerebellum, T; tegmentum, EC; epiphysis, nTOPC; nucleus of the tract of the post optic commissure, allg; anterior lateral line ganglion, pllg; posterior lateral line ganglion, and R; rhombomeres. (E, F) Two color WISH for spatiotemporal distribution of the transcripts from prune2 transcripts and huC (fluorescence-label). (G, H) Two color WISH for spatiotemporal distribution of the transcripts from prune2 and krox20 (fluorescence-label). Arrowheads indicate R3 and R5. All scale bars in red indicate 50 μm. A, B, E, G; lateral view anterior to left. C, D, F, H; dorsal view, C, F, H; anterior to left, and D; anterior to right. EXPRESSION / LABELING:
|
|
Distribution of prune2 transcripts in the early larval development.prune2 messages were restricted to the CNS at 36 hpf through 120 hpf. A-C, E, F; dorsal view. D; magnified retina of the embryo at 72 hpf in panel C. CMZ; Ciliary Marginal Zone, GCL; Ganglion Cell Layer, INL; Inner nuclear Layer, TC; telencephalon, DC; diencephalon, HB; hind brain, CB; cerebellum. All scale bars in red indicate 50 μm. B′ is the transverse section along the black line of panel B. |
|
Spatial distribution of prune2 transcripts in the adult brain. Brains from 5 month old adult male zebrafishes were dissected to examine spatiotemporal expression patterns of prune2 transcripts. A, B; dorsal view, anterior to top. PVO; paraventricular organ, PvPp; posterior periventricular preoptic nucleus, GC; griseum centrale, LR; lateral recess of diencephalic ventricle, TE; telencephalon, TO; tectum opticum, CB; corpus cerebelli. All scale bars in red indicate 200 μm. EXPRESSION / LABELING:
|
|
prune2 transcripts in mib−/−, a Notch signaling mutant, (A, B) Heterozygous mutant embryos. (C, D) Homozygous mutant embryos. All scale bars in red indicate 50 μm. |
|
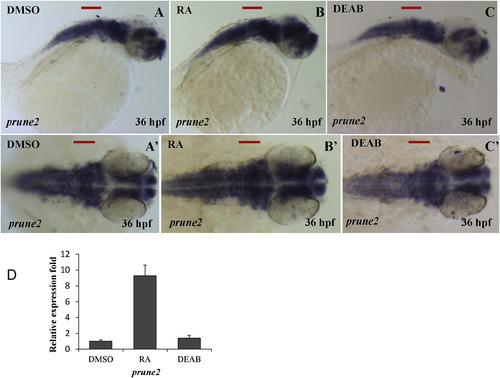
RA signaling regulates level of prune2 transcripts in the zebrafish embryos. Embryos at 29 hpf were treated with RA (Sigma, 0.1 μM in DMSO) or DEAB (Aldrich, 10 μM in DMSO) for 3 h. The treated embryos were fixed at 35 hpf for WISH analysis. prune2 transcripts were elevated in the RA treated embryos (B, B′) but reduced in the DEAB treated embryos (C, C′), which were further confirmed by qPCR (D). A, B, C; lateral view anterior to left. A′, B′, C'; dorsal view anterior to left. All scale bars in red indicate 50 μm. |
Reprinted from Gene expression patterns : GEP, 23-24, Anuppalle, M., Maddirevula, S., Kumar, A., Huh, T.L., Choe, J., Rhee, M., Expression patterns of prune2 is regulated by Notch and retinoic acid signaling pathways in the zebrafish embryogenesis, 45-51, Copyright (2017) with permission from Elsevier. Full text @ Gene Expr. Patterns


