Image
Figure Caption
Fig. 1
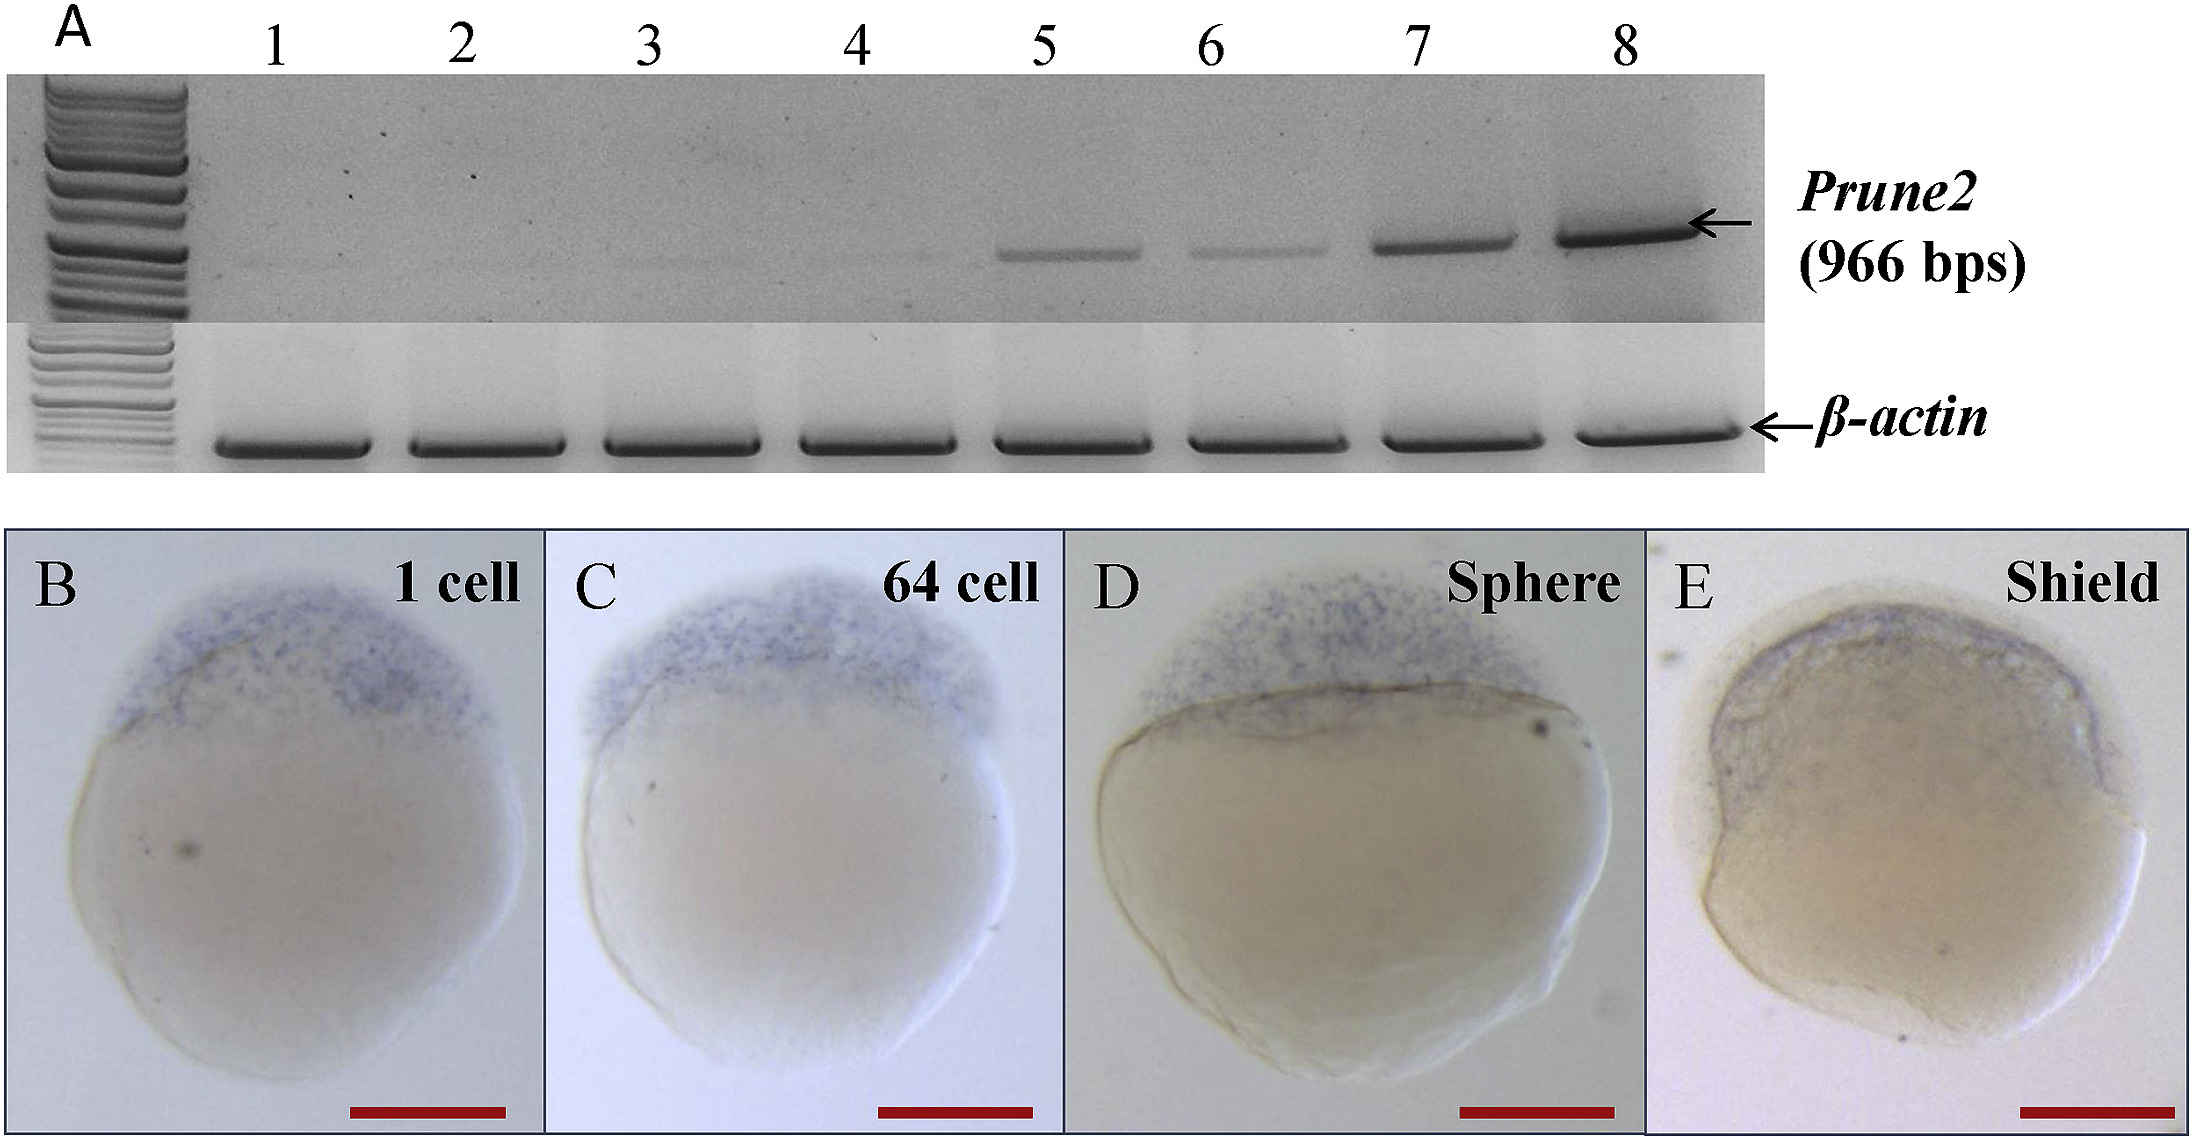
Spatio-temporal distribution of prune2 transcripts in early embryonic stages. (A) Analysis of prune2 transcripts by RT-PCR at different embryonic stages, 1-cell, sphere, shield, 10 hpf, 18 hpf, 24 hpf, 36 hpf, and 48 hpf. (B–E) Analysis of prune2 transcripts at 1 cell, 64 cell, sphere, and shield stage by WISH. prune2 maternal transcripts were found at low level in 1 cell stage while they were not notable till shield stage. B-E; dorsal views. All scale bars in red indicate 50 μm.
Figure Data
Acknowledgments
This image is the copyrighted work of the attributed author or publisher, and
ZFIN has permission only to display this image to its users.
Additional permissions should be obtained from the applicable author or publisher of the image.
Reprinted from Gene expression patterns : GEP, 23-24, Anuppalle, M., Maddirevula, S., Kumar, A., Huh, T.L., Choe, J., Rhee, M., Expression patterns of prune2 is regulated by Notch and retinoic acid signaling pathways in the zebrafish embryogenesis, 45-51, Copyright (2017) with permission from Elsevier. Full text @ Gene Expr. Patterns

