
- Title
-
Arhgap36-dependent activation of Gli transcription factors
- Authors
- Rack, P.G., Ni, J., Payumo, A.Y., Nguyen, V., Crapster, J.A., Hovestadt, V., Kool, M., Jones, D.T., Mich, J.K., Firestone, A.J., Pfister, S.M., Cho, Y.J., Chen, J.K.
- Source
- Full text @ Proc. Natl. Acad. Sci. USA
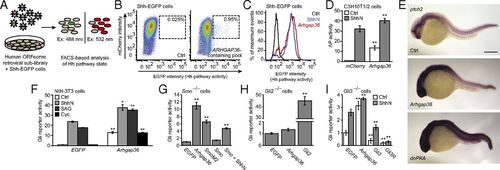
Identification of Arhgap36 as a Hh pathway activator. (A) Schematic representation of the cDNA overexpression screen. (B) FACS scatter plots revealing a retroviral pool that induces Hh ligand-independent pathway activation. Retroviral transduction of mCherry alone served as a negative control, and the percentage of total cells within the sorting gate (dashed box) for each condition is indicated. Deconvolution of this sublibrary identified ARHGAP36 as the active component. (C) FACS histogram plots demonstrating the response of Shh-EGFP cells to ShhN or exogenous Arhgap36. (D) Alkaline phosphatase (AP) levels in C3H10T1/2 cells transduced with mCherry or Arhgap36 and then cultured in the absence or presence of ShhN for 48 h. Data are the average ± SEM, n = 8. (E) Expression levels of ptch2 in uninjected zebrafish embryos (Top) or those injected with Arhgap36 (Middle) or dnPKA (Bottom) mRNA. Lateral views of 24-hpf embryos are shown. (Scale bar: 200 μm.) (F) Hh pathway activities in NIH-3T3 cells cotransfected with Gli-dependent firefly luciferase and SV40-driven Renilla luciferase reporters and either EGFP or Arhgap36. The cells were then treated with ShhN, 200 nM SAG, or 5 µM cyclopamine for 30 h. Data are the average ± SEM, n = 3. (G) Hh pathway activities in Smo−/− MEFs cotransfected with the luciferase reporters and designated cDNAs. (H) Hh pathway activities in Gli2−/− MEFs cotransfected with the luciferase reporters and designated cDNAs for 48 h. (I) Hh pathway activities in Gli3−/− MEFs cotransfected with the luciferase reporters and designated cDNAs and then cultured in the absence of presence of ShhN for 30 h. Data for G–I are the average ± SEM, n = 4. Statistical analyses: Single and double asterisks indicate P < 0.05 and P < 0.01, respectively (D, Arhgap36 vs. mCherry for each cell culture condition; F, Arhgap36 vs. EGFP for each cell culture condition; G–I, each designated gene versus EGFP). |

ZFIN is incorporating published figure images and captions as part of an ongoing project. Figures from some publications have not yet been curated, or are not available for display because of copyright restrictions. |
|
ZFIN is incorporating published figure images and captions as part of an ongoing project. Figures from some publications have not yet been curated, or are not available for display because of copyright restrictions. EXPRESSION / LABELING:
|