
- Title
-
Small G protein Rac GTPases regulate the maintenance of glioblastoma stem-like cells in vitro and in vivo
- Authors
- Lai, Y.J., Tsai, J.C., Tseng, Y.T., Wu, M.S., Liu, W.S., Lam, H.I., Yu, J.H., Nozell, S.E., Benveniste, E.N.
- Source
- Full text @ Oncotarget
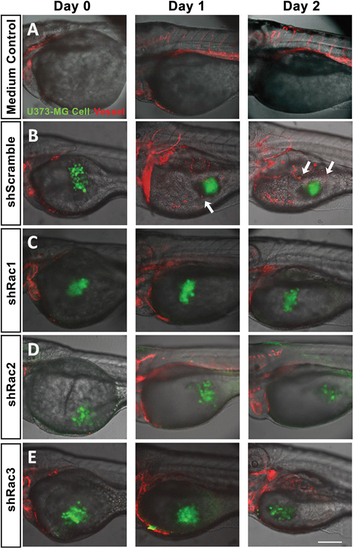
In vivo zebrafish xenotransplantation model of U373-MG tumorsphere cells with shRacs. Tumorspheroid cells derived from U373-MG harboring control scramble sequences or shRacs and GFP expressing sequences were injected into the yolks of 2 dpf stage zebrafish Tg(kdr:mcherry) embryos. About 300~400 cells were injected for each embryo with 20% Matrigel in the sphere culture medium. Culture medium without cells was also injected into the yolk of embryos to serve as negative control. Confocal microscopy images were taken on the time indicated (TCS SP2, Leica). A. Inject with medium only. B. U373-shScramble cells. C. U373-shRac1 cells. D. U373-shRac2 cells. E. U373-shRac3 cells. Data shown were the representative from at least three independent experiments. Embryos injected number: n=20 for each group. GFP (green) represents glioblastoma spheroid cells, and mCherry (red) represents the vessels of the zebrafish embryos. Arrows show the angiogenesis revealing new vessels growing towards the injected tumor spheroid cells. Scale bar = 200 μm. |
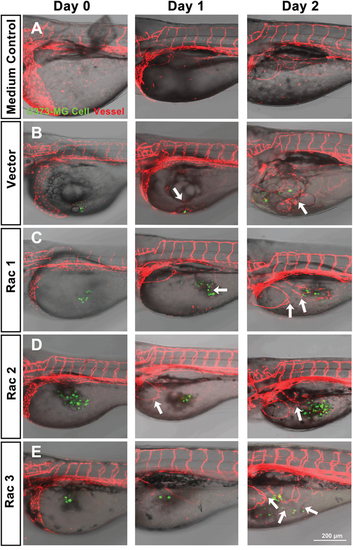
In vivo zebrafish xenotransplantation model of U373-MG tumorsphere cells with overexpressed Racs. Same as described in Figure 6, tumorspheroid cells derived from U373-MG harboring control GFP or Rac cDNAs were injected into the yolks of 2 dpf stage zebrafish Tg(kdr:mcherry) embryos. Confocal microscopy images were taken on the time indicated (LSM880, ZEISS). A. Inject with medium only. B. U373-vector cells. C. U373-Rac1 cells. D. U373-Rac2 cells. E. U373-Rac3 cells. Data shown were the representative from at least three independent experiments. Embryos injected number: n=10~15 for each group. GFP (green) represents glioblastoma spheroid cells, and mCherry (red) represents the vessels of the zebrafish embryos. Arrows show the angiogenesis which the new vessel branches approaching the injected tumor spheroid cells. Scale bar = 200 μm. |