
- Title
-
An Autophagic Flux Probe that Releases an Internal Control
- Authors
- Kaizuka, T., Morishita, H., Hama, Y., Tsukamoto, S., Matsui, T., Toyota, Y., Kodama, A., Ishihara, T., Mizushima, T., Mizushima, N.
- Source
- Full text @ Mol. Cell

Temporal Analysis of Induced Autophagy In Vivo in Live Zebrafish (A) Representative images of GFP and RFP fluorescence signals in zebrafish embryos at 2 days post-fertilization (dpf) injected with GFP-LC3-RFP-LC3ΔG mRNA. Scale bar, 0.5 mm. (B) Immunoblot analysis detecting LC3-fusion proteins in wild-type, GFP-LC3-RFP-LC3ΔG transgenic, and GFP-LC3-RFP-LC3ΔG mRNA-injected zebrafish at 2 dpf. The asterisk indicates a non-specific band. (C) Representative fluorescence ratio images of skeletal muscle in GFP-LC3-RFP-LC3ΔG transgenic zebrafish. Zebrafish (1 dpf) were treated with 250 nM Torin1 for the indicated incubation times. Magnified images of the indicated regions are shown in the insets. Scale bar, 10 μm and 2 μm (inset). The graph shows the GFP/RFP fluorescence ratio as a percentage relative to that in untreated zebrafish at 0 hr. (D) A schematic diagram of a fertilized egg at the one-cell stage and GFP-LC3 signals of GFP-LC3-RFP-LC3ΔG transgenic zebrafish eggs. mpf, min post-fertilization. Magnified images of the indicated regions are shown in the insets. Scale bar, 5 μm (insets). (E) GFP-LC3 and LysoTrackerRed signals at 2 hr post-fertilization (hpf) in GFP-LC3-RFP-LC3ΔG transgenic zebrafish eggs immersed in LysoTracker Red for 2 hr. Black lines in the differential interference contrast (DIC) image indicate cell boundaries. As RFP-LC3ΔG signals were not detected as dot-like patterns (data not shown), they can be distinguished from the punctate LysoTracker Red signals. The indicated regions are shown and magnified in the insets. Scale bar, 5 μm (insets). (F) Representative time-lapse images of fertilized eggs of GFP-LC3-RFP-LC3ΔG transgenic zebrafish at the indicated times (hpf). Scale bar, 200 μm. The graph shows the GFP/RFP fluorescence ratio in the blastomere as a percentage relative to that at 0.5 hpf. Data are representatives of three independent experiments (A–F). See also Figure S3 and Movie S1. |
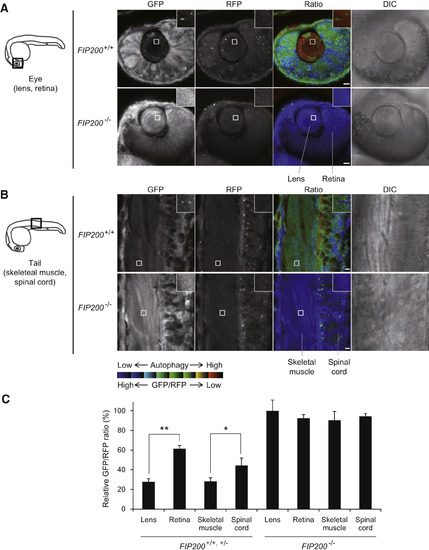
Spatial Analysis of Basal Autophagic Flux In Vivo in Live Zebrafish (A and B) A schematic diagram of 1 dpf zebrafish and representative images of GFP and RFP fluorescence signals and DIC in the eye (lens and retina) (A) and tail (skeletal muscle and spinal cord) (B) of FIP200+/+ and FIP200−/− zebrafish embryos injected with GFP-LC3-RFP-LC3ΔG mRNA. Images of the indicated regions are shown in the insets. Scale bar, 10 μm. (C) The graph shows the GFP/RFP fluorescence ratio of the indicated tissues of control (FIP200+/+, FIP200+/−, n = 3) and FIP200−/− (n = 4) zebrafish embryos injected with GFP-LC3-RFP-LC3ΔG mRNA. Values are expressed as a percentage relative to that of FIP200−/− zebrafish lens. Data represent mean ± SEM. ∗p < 0.05 and ∗∗p < 0.005. Data are representatives of three independent experiments. PHENOTYPE:
|
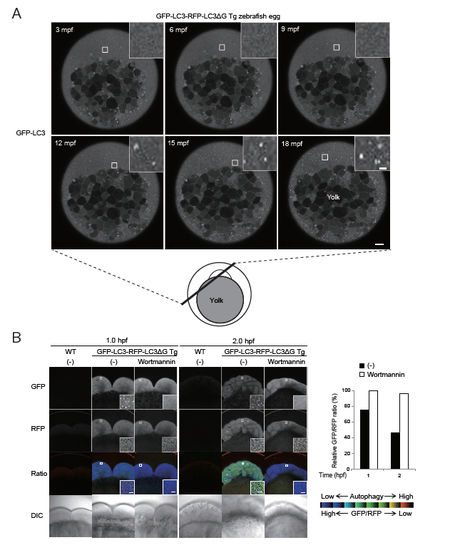
Induction of autophagy in fertilized zebrafish eggs (related to Figure 4) (A) A schematic diagram of a fertilized zebrafish egg and GFP-LC3 signals in a GFP-LC3-RFP-LC3ΔG transgenic zebrafish egg at the indicated time (min post fertilization (mpf)). GFP-LC3 puncta appeared throughout the egg except for the yolk from approximately 12 mpf. The indicated regions are magnified in the insets. Scale bar, 10 μm and 1 μm (insets). (B) Representative fluorescence and DIC images of fertilized eggs of wild-type and GFP-LC3-RFP-LC3ΔG transgenic zebrafish treated with or without 500 nM wortmannin at 1 and 2 h post fertilization. The graph shows the GFP/RFP fluorescence ratio in the blastomeres as a percentage relative to that of wortmannintreated eggs at 1 hpf. The indicated regions are shown and magnified in the insets. Scale bar, 5 μm. Data are representative of two independent experiments. |