
Fig. 5
- ID
- ZDB-IMAGE-161219-18
- Publication
- Kaizuka et al., 2016 - An Autophagic Flux Probe that Releases an Internal Control
- All Figures
- Figures for Kaizuka et al., 2016
|
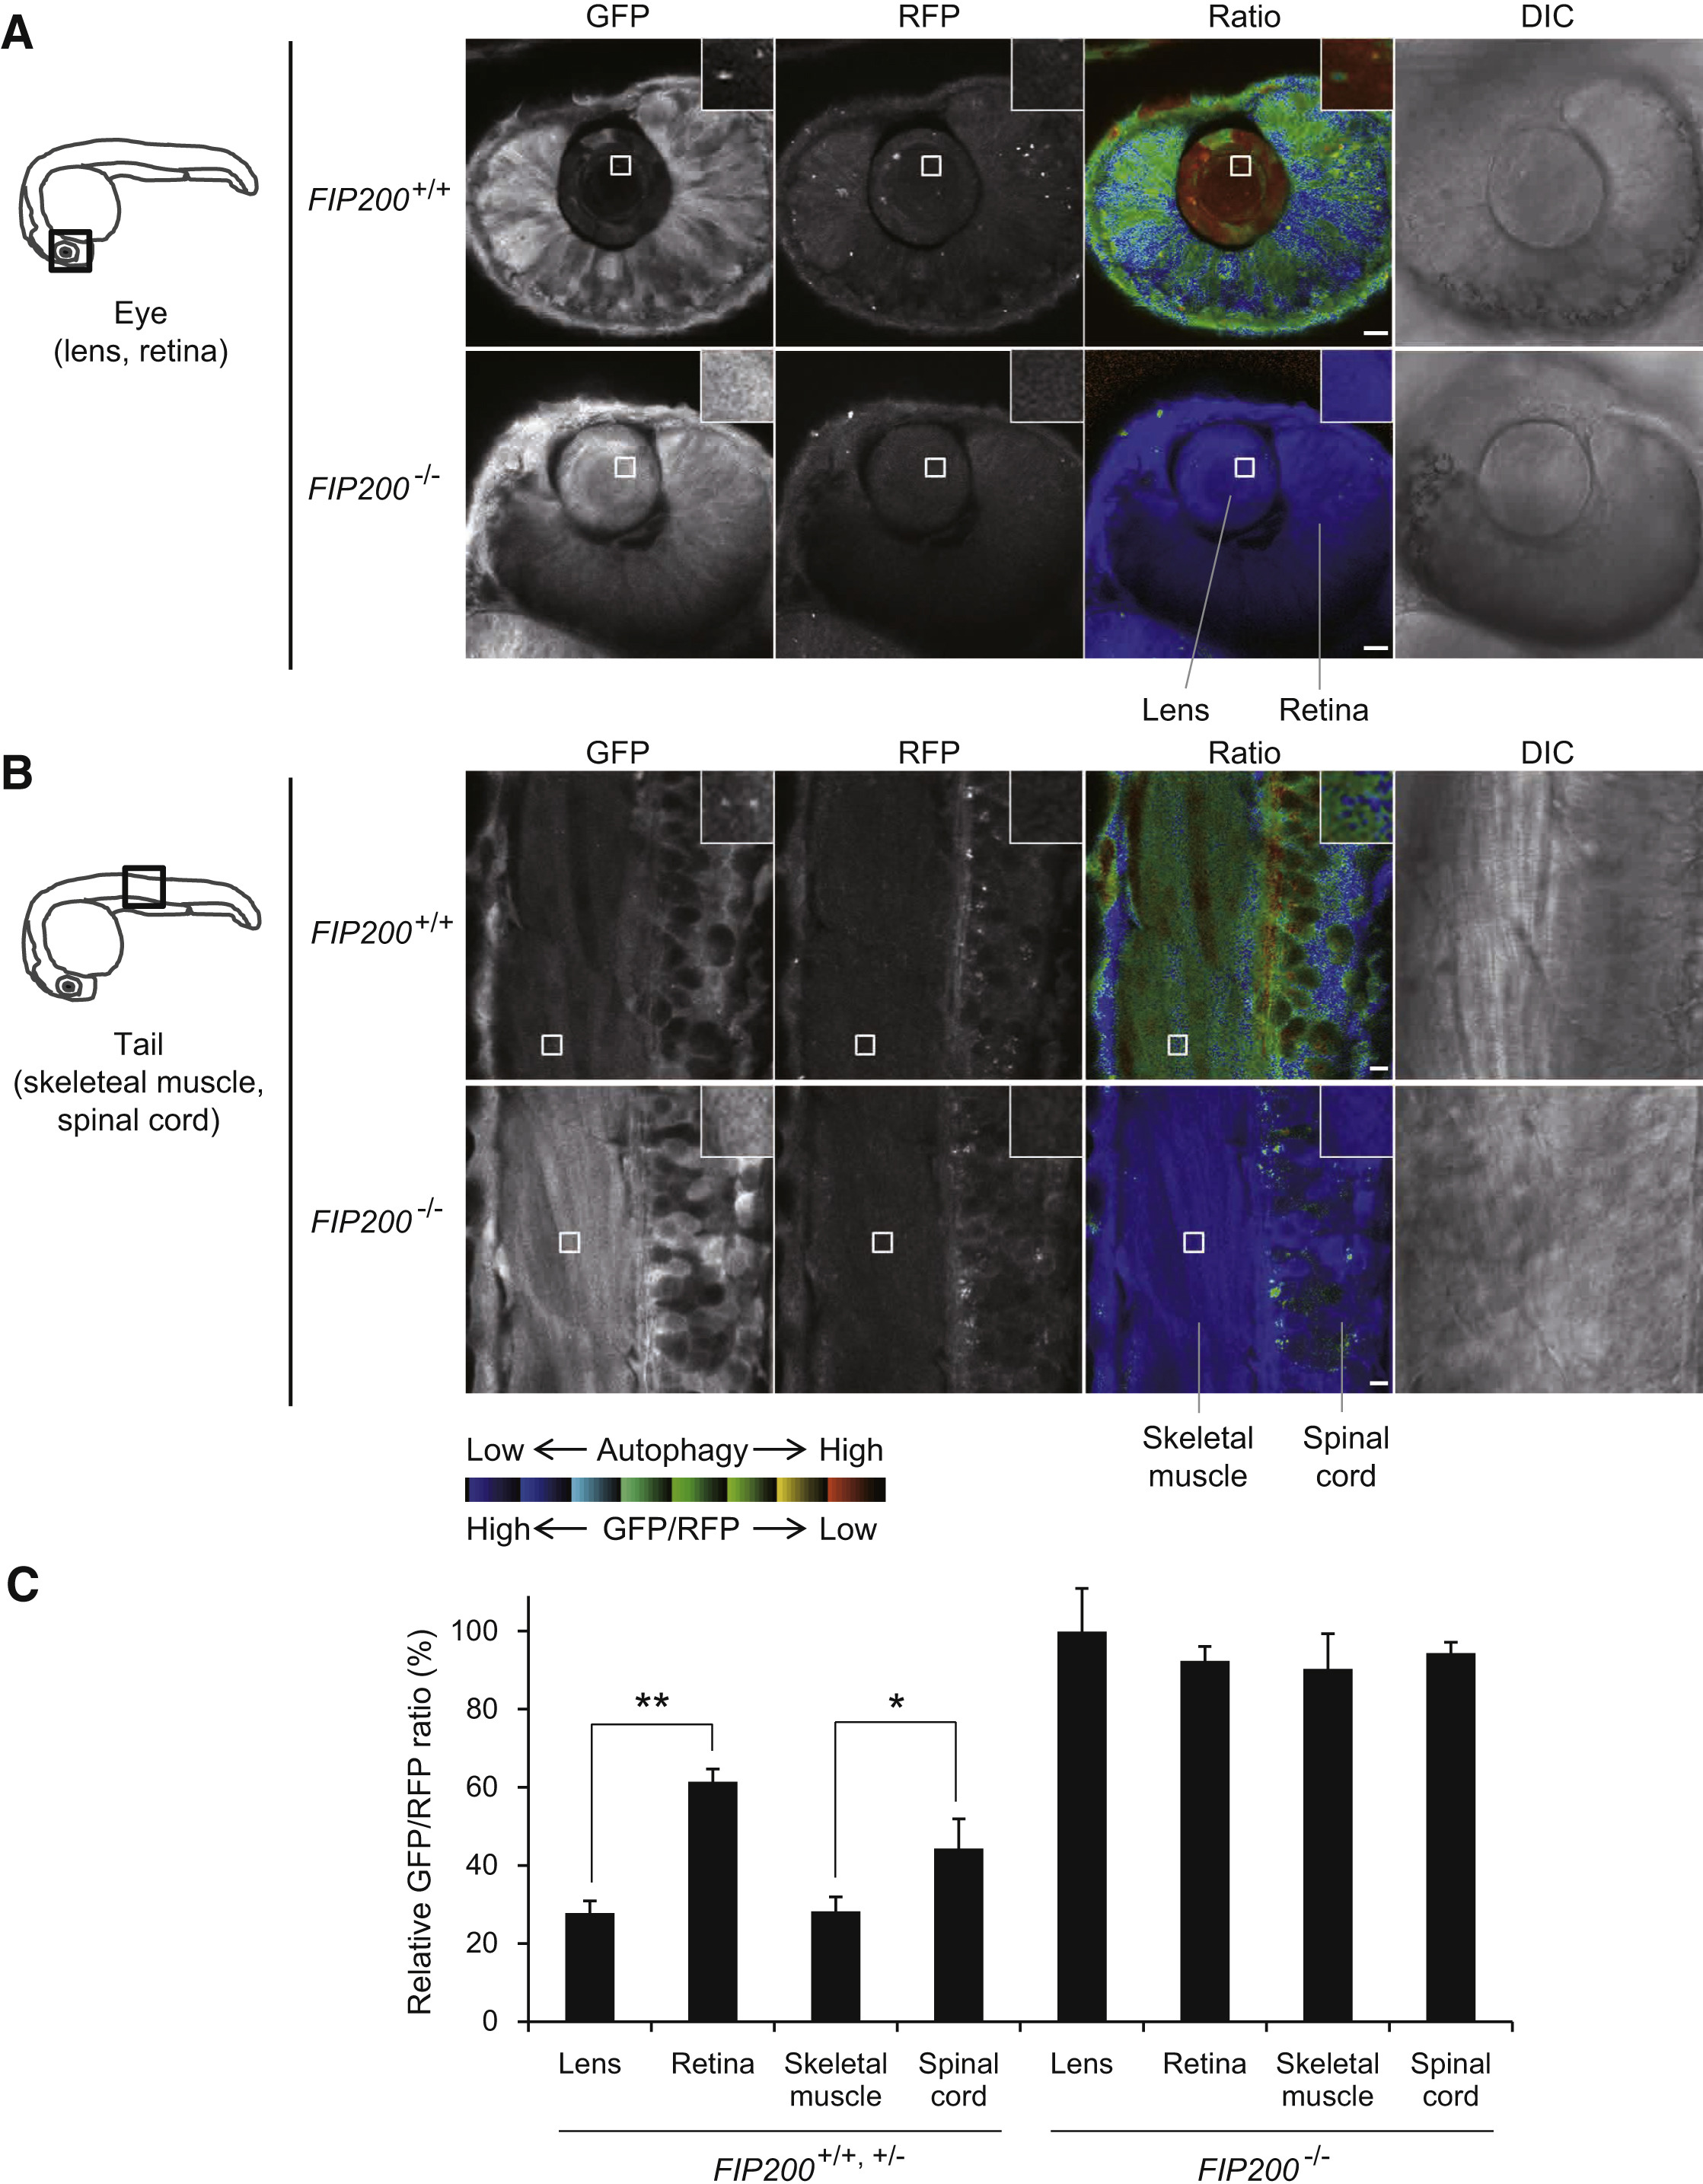
Fig. 5
Spatial Analysis of Basal Autophagic Flux In Vivo in Live Zebrafish
(A and B) A schematic diagram of 1 dpf zebrafish and representative images of GFP and RFP fluorescence signals and DIC in the eye (lens and retina) (A) and tail (skeletal muscle and spinal cord) (B) of FIP200+/+ and FIP200−/− zebrafish embryos injected with GFP-LC3-RFP-LC3ΔG mRNA. Images of the indicated regions are shown in the insets. Scale bar, 10 μm.
(C) The graph shows the GFP/RFP fluorescence ratio of the indicated tissues of control (FIP200+/+, FIP200+/−, n = 3) and FIP200−/− (n = 4) zebrafish embryos injected with GFP-LC3-RFP-LC3ΔG mRNA. Values are expressed as a percentage relative to that of FIP200−/− zebrafish lens. Data represent mean ± SEM. ∗p < 0.05 and ∗∗p < 0.005. Data are representatives of three independent experiments.