
- Title
-
Modeling the Behavior of Red Blood Cells within the Caudal Vein Plexus of Zebrafish
- Authors
- Djukic, T.R., Karthik, S., Saveljic, I., Djonov, V., Filipovic, N.
- Source
- Full text @ Front. Physiol.
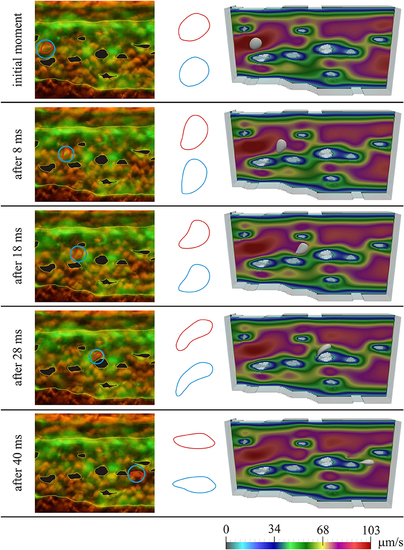
Comparison of experimental results with results obtained using numerical simulation, for the first initial position of the RBC; left—microscopic image of the zebrafish, with denoted considered RBC; middle—isolated shapes of the considered RBC (red—experiment; blue—simulation); right—results obtained using numerical simulation. Colors on the images obtained using numerical simulations denote the intensity of the blood velocity, according to the scale bar at the bottom of the Figure. The blood flow through capillary plexus of the living zebrafish was observed 32 h post fertilization. |
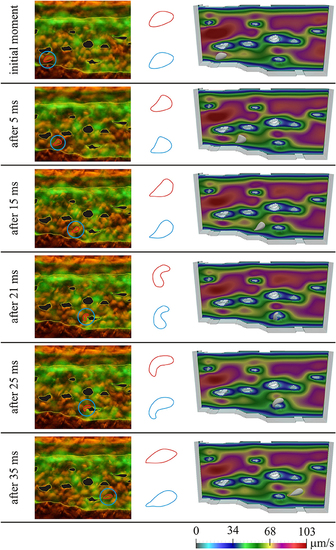
Comparison of experimental results with results obtained using numerical simulation, for the second initial position of the RBC; left—microscopic image of the zebrafish, with denoted considered RBC; middle—isolated shapes of the considered RBC (red—experiment; blue—simulation); right—results obtained using numerical simulation. Colors on the images obtained using numerical simulations denote the intensity of the blood velocity, according to the scale bar at the bottom of the Figure. The blood flow through capillary plexus of the living zebrafish was observed 32 h post fertilization. |