
Image
|
Figure Caption
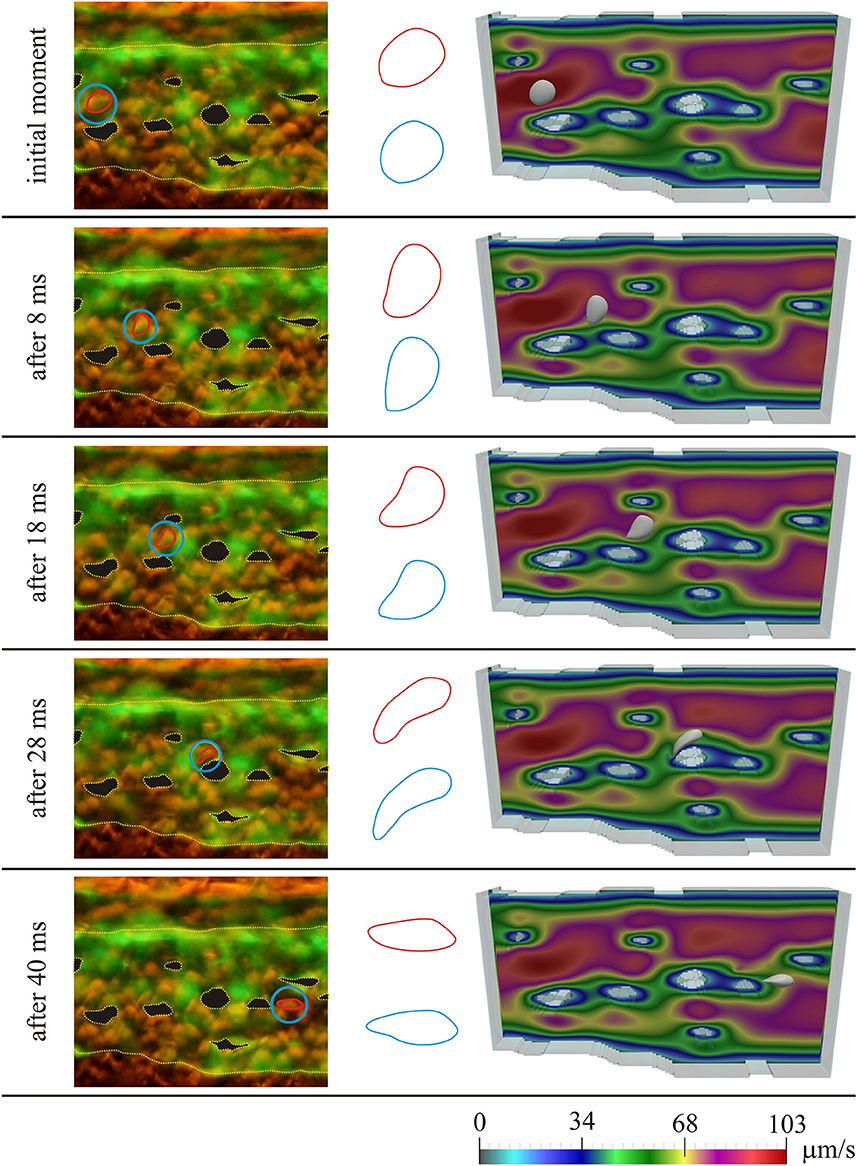
Fig. 3
Comparison of experimental results with results obtained using numerical simulation, for the first initial position of the RBC; left—microscopic image of the zebrafish, with denoted considered RBC; middle—isolated shapes of the considered RBC (red—experiment; blue—simulation); right—results obtained using numerical simulation. Colors on the images obtained using numerical simulations denote the intensity of the blood velocity, according to the scale bar at the bottom of the Figure. The blood flow through capillary plexus of the living zebrafish was observed 32 h post fertilization.
Acknowledgments
This image is the copyrighted work of the attributed author or publisher, and
ZFIN has permission only to display this image to its users.
Additional permissions should be obtained from the applicable author or publisher of the image.
Full text @ Front. Physiol.