
- Title
-
Real-time prediction of cell division timing in developing zebrafish embryo
- Authors
- Kozawa, S., Akanuma, T., Sato, T., Sato, Y.D., Ikeda, K., Sato, T.N.
- Source
- Full text @ Sci. Rep.
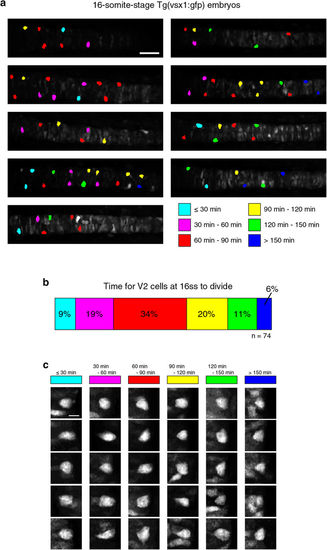
V2 cell-shapes and cell-division timing. (a) Nine TgBAC(vsx1:GFP)nns5 zebrafish embryos at the 16-somite stage. Shown are dorsal views of trunk spinal cord region with anterior side of the embryo on the left. GFP+ V2 cells are color-coded according to the times when they begin to divide. Scale bar, 50 μm. (b) Variability in V2 cell division timing. Color codes are the same as in a. See also Supplementary Fig. 1 and Supplementary Movie 1. (c) Shapes of V2 cells in relation to their division timing. Stacked images of individual V2 cells in a. are shown. Images are dorsal view (relative to the whole embryo) with the apical side of the cell on the left. Scale bar, 10 μm. |
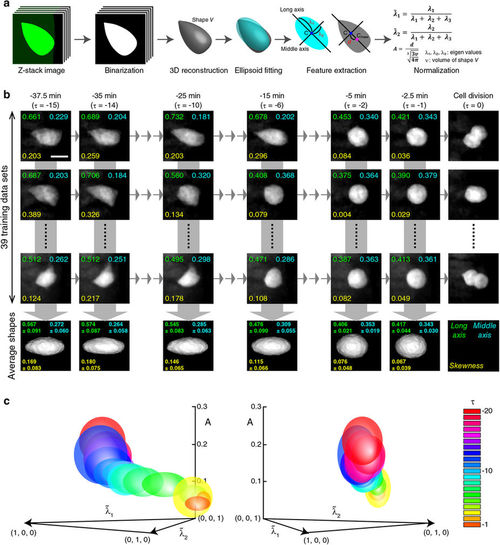
Quantitative shape features of V2 cells in relation to their division timing. (a) Image processing and measurements of V2 cell-shape features. The short axis is not shown in the figure, but it points to the direction perpendicular to both long and middle axes. Though not shown in the figure, |
 is the normalized eigenvalue along the short axis. (b) Generation of probabilistic shape features of V2 cells at each time-point. Shape-features of each of the 39 cells at each time-point are shown. Average shapes based on the statistical modeling of the 39 shape-features are shown at the bottom for each time-point. Long axis (i.e.,
  ), Middle axis (i.e.,
  ), Skewness (i.e., A) values are indicated at the top left, top right, bottom left, in each panel, respectively. (c) Probabilistic distributions of shape-features at each time-point. Distributions for each time-point (τ = −20–−1 are color-coded and plotted on the 3D space (A,
  ) (see also “Quantitative characterization of cell-shape” section of Methods). Views from two different angles are shown.

Bayesian inference to predict the division-timing. (a) Prediction of the division-timing of V2 cells at the start of image-tracking. See “Bayesian inference to predict cell-division timing” section of Methods for details. (b) Sequential Bayesian inference method to predict the division-timing of V2 cells using time-series images of individual cells. See “Sequential Bayesian inference to predict cell-division timing” section of Methods for details. |

Real-time prediction system. The method of real-time prediction is schematically shown. Here, the successive shape changes of the boxed GFP+ V2 cell (the left and middle columns) were tracked at 2.5 min intervals (middle column) and the remaining time to division was predicted using sequential Bayesian inference and plotted as dots (right column). See also “Real-time prediction of cell-division timing” section of Methods. Scale bars, 50 μm and 10 μm for the left and middle columns, respectively. |
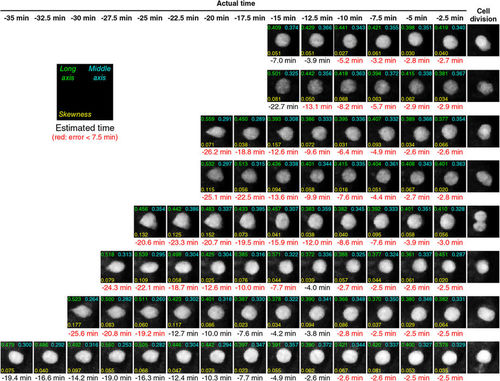
Real-time prediction of division-timing of individual V2 cells. A total of eight individual V2 cells were subjected to the real-time prediction system shown in Fig. 6 (see also “Real-time prediction of cell-division timing” section of Methods) and the results of the predictions are shown for each time-point. Long axis (i.e., |
 ), Middle axis (i.e.,
  ), Skewness (i.e., A) values are indicated at the top left, top right, bottom left, in each panel, respectively. The predicted times in red-color at the bottom of each image panel are those within 7.5 min (equivalent to three time-steps) accuracy. Scale bar, 10 μm.
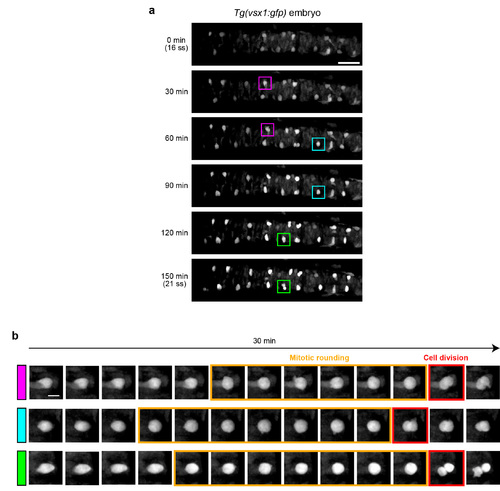
Behavior and dynamical shape changes of V2 cells. (a) Time-lapse images of GFP+ V2 cells from the 16-somite stage (0 min) until the 21-somite stage (150 min). Shown are dorsal views of the embryo. Anterior side of the embryo is on the left. Time interval = 30 min. Cells boxed by the colored outlines are those shown in (b). Scale bar, 50 μm. (b) Successive shape changes of individual V2 cells. The cells boxed by the colored outlines in (a) are shown. Apical side is on the left. Mitotic rounding (boxes outlined by orange outlines) and cell-division (boxes outlined by red outlines) phases are indicated. Time interval = 2.5 min. Scale bar, 10 μm. |