
|
Fig. S1
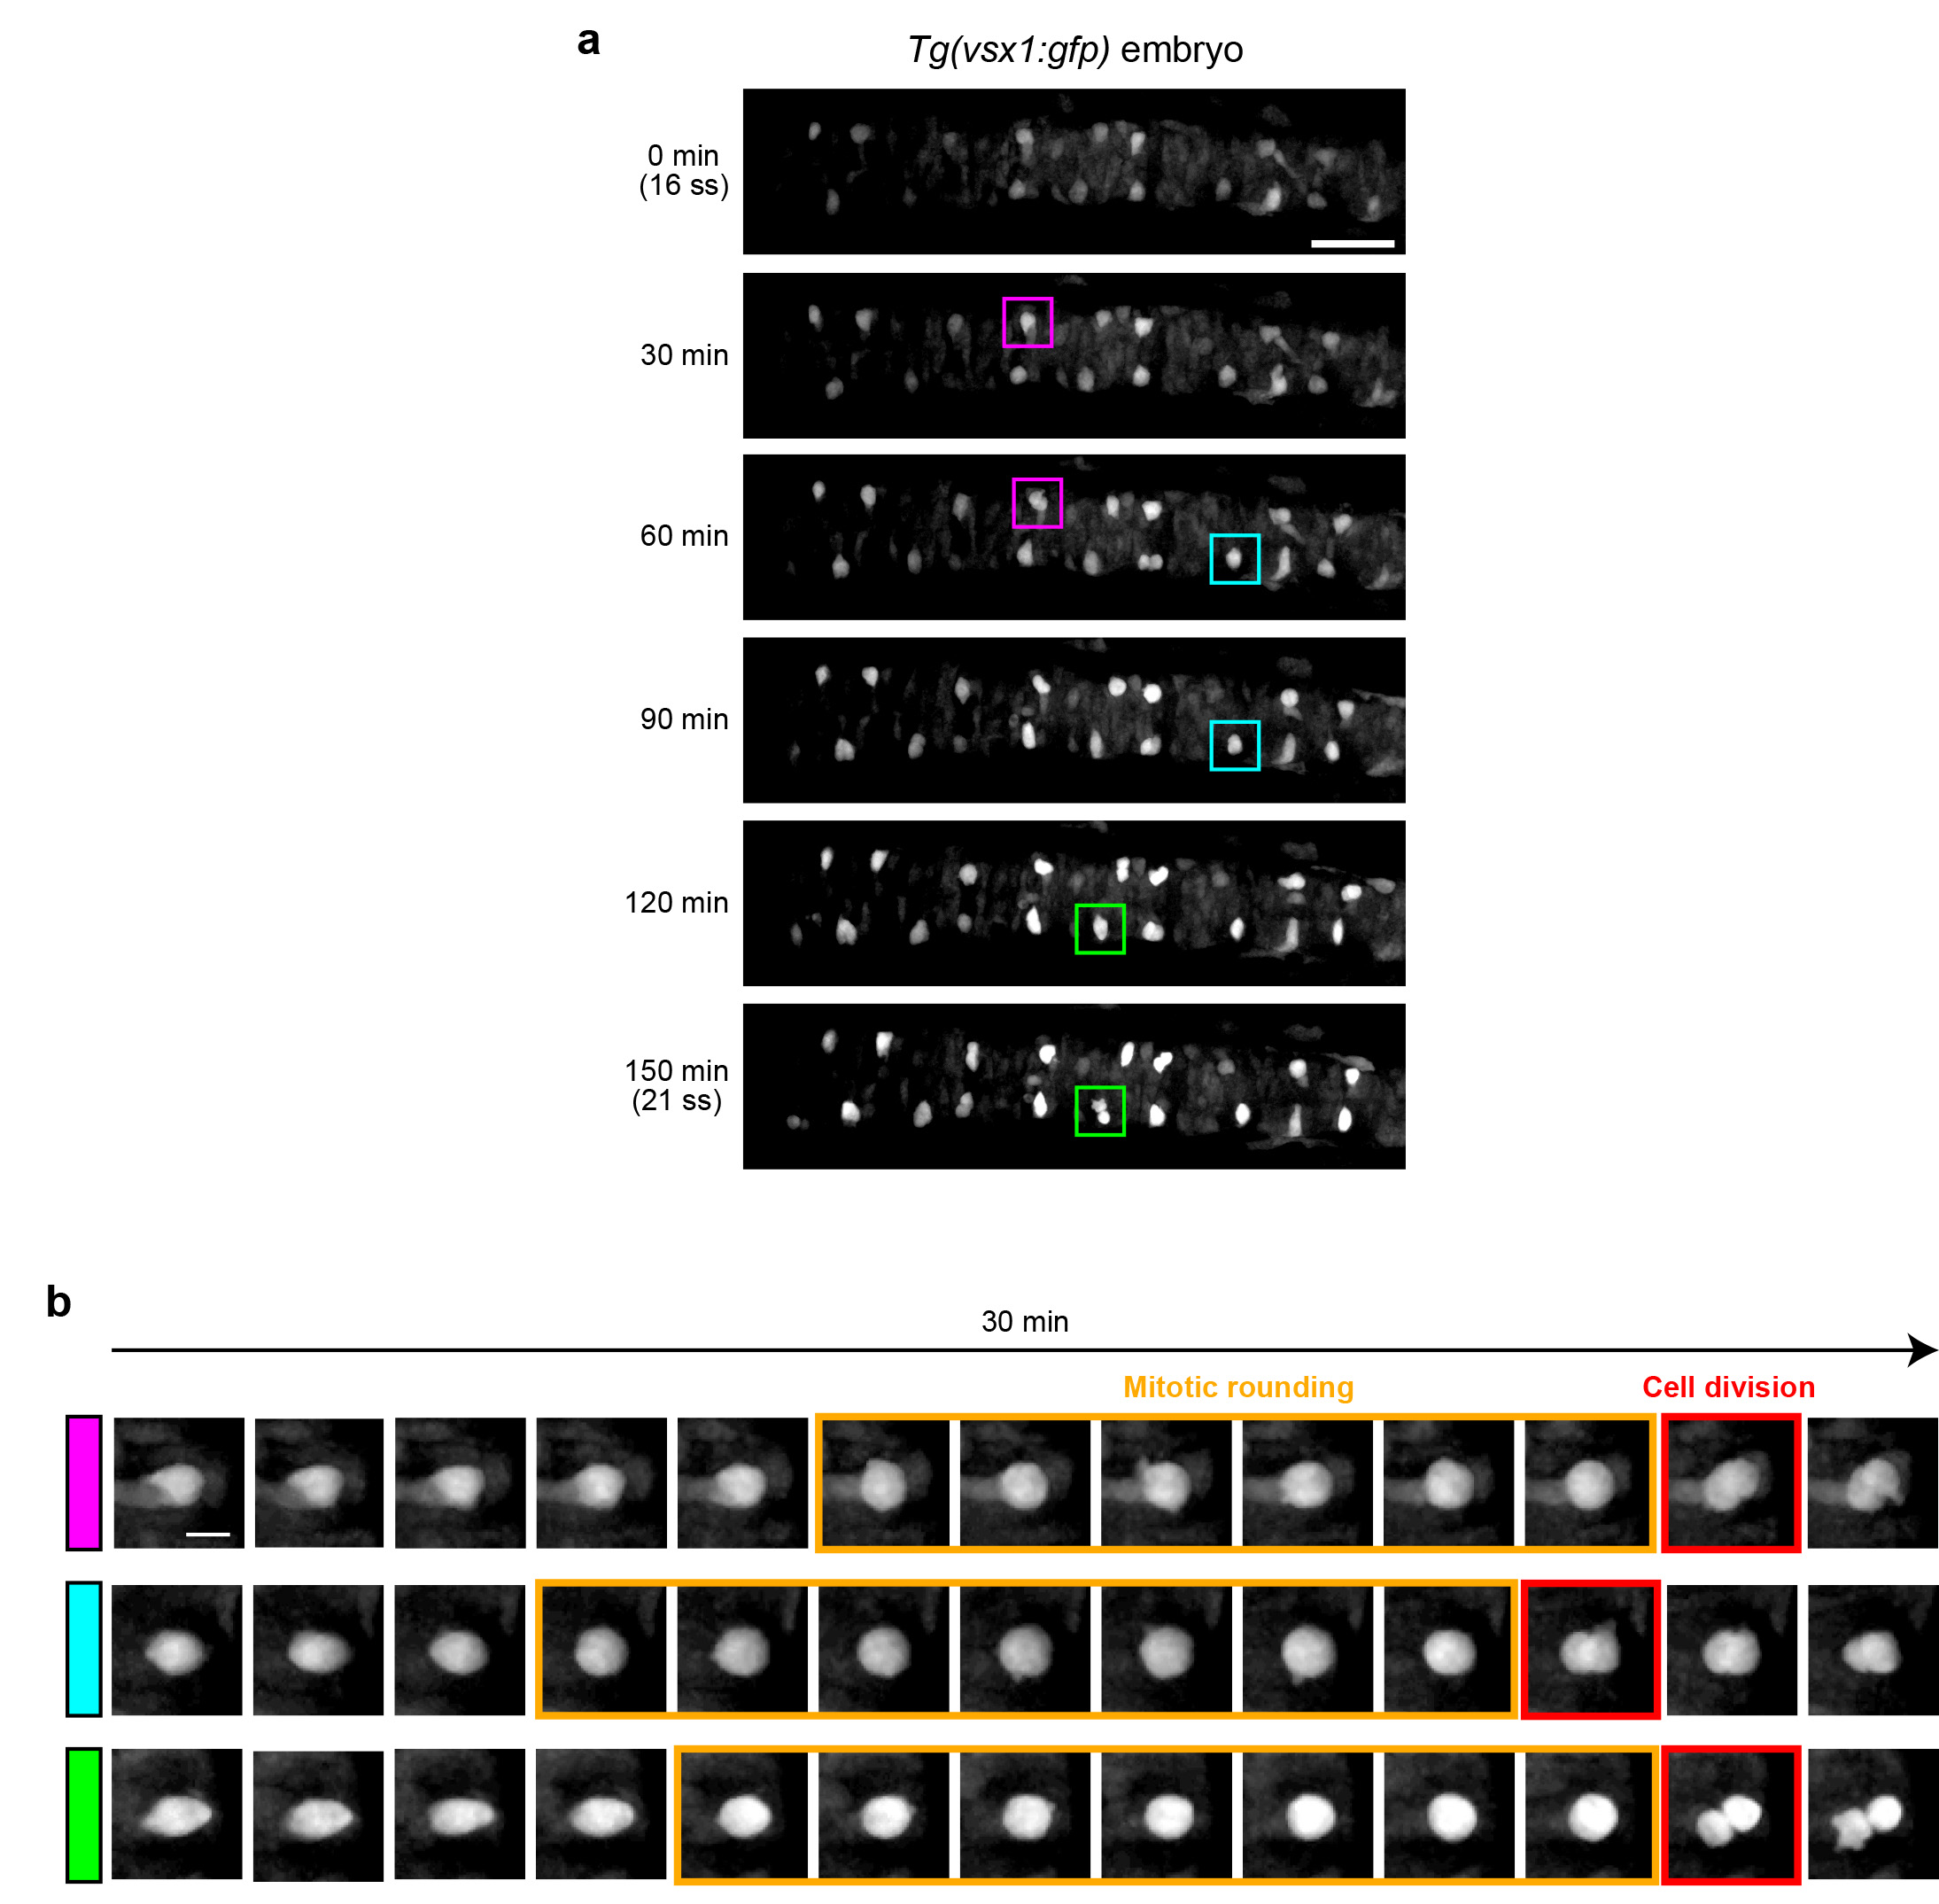
Behavior and dynamical shape changes of V2 cells.
(a) Time-lapse images of GFP+ V2 cells from the 16-somite stage (0 min) until the 21-somite stage (150 min). Shown are dorsal views of the embryo. Anterior side of the embryo is on the left. Time interval = 30 min. Cells boxed by the colored outlines are those shown in (b). Scale bar, 50 μm. (b) Successive shape changes of individual V2 cells. The cells boxed by the colored outlines in (a) are shown. Apical side is on the left. Mitotic rounding (boxes outlined by orange outlines) and cell-division (boxes outlined by red outlines) phases are indicated. Time interval = 2.5 min. Scale bar, 10 μm.