
- Title
-
Progestins alter photo-transduction cascade and circadian rhythm network in eyes of zebrafish (Danio rerio)
- Authors
- Zhao, Y., Fent, K.
- Source
- Full text @ Sci. Rep.
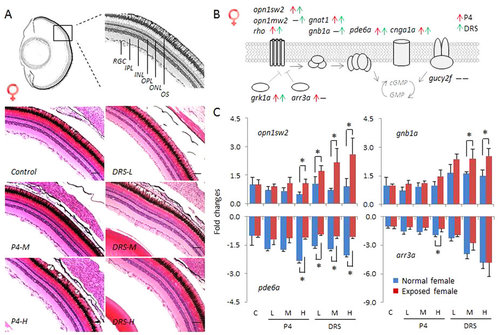
Histology and transcriptional responses of photo-transduction genes in eyes of females. (A) Transverse sections of eyes of female zebrafish exposed to solvent control, and different concentrations of P4 and DRS. Upper diagram represents the sampling section of zebrafish eye, lower diagram responses to P4 and DRS. Scale bar = 50 µm. Key: RGC: retinal ganglion cell; IPL: inner plexiform layer; INL: inner nuclear layer; OPL: outer plexiform layer; ONL: outer nucleus layer; OS: outer segment. (B) Schematic diagram depicts the photo-transduction cascade in zebrafish and ten key genes measured in the present study. Red arrow: up-regulated genes in response to P4. Green arrow: up-regulated genes in response to DRS. (C) Transcriptional responses of four key genes (opn1sw2, gnb1a, pde6a and arr3a) expressed as fold-changes compared to unexposed (normal) females sampled at the same time-point. Blue bars in each figure represent gene expressions of unexposed (normal) females. Red bars in each figure represent gene expressions of exposed females; Solvent control and P4 and DRS-exposed. Key for concentrations (red bars): P4: L: low dose (7 ng/L); M: middle dose (116 ng/L); H: high dose (742 ng/L). DRS: L: low dose (99 ng/L); M: middle dose (2´763 ng/L); H: high dose (13´650 ng/L). |
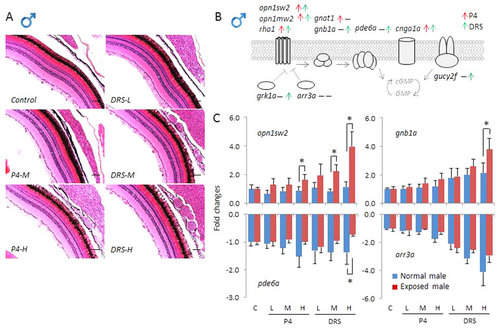
Histology and transcriptional responses of photo-transduction genes in eyes of males. (A) Transverse sections of eyes of male zebrafish exposed to solvent control, and different concentrations of P4 and DRS. Scale bar = 50 µm. (B) Schematic diagram depicts the photo-transduction cascade in zebrafish and ten key genes measured in the present study. Red arrow: up-regulated genes in response to P4. Green arrow: up-regulated genes in response to DRS. (C) Transcriptional responses of four key genes (opn1sw2, gnb1a, pde6a and arr3a) expressed as fold-changes compared to unexposed (normal) males sampled at the same time-point. Blue bars in each figure represent gene expressions of unexposed (normal) males. Red bars in each figure represent gene expressions of exposed females; Solvent control and P4 and DRS-exposed. Key for concentrations (red bars): P4: L: low dose (7 ng/L); M: middle dose (116 ng/L); H: high dose (742 ng/L). DRS: L: low dose (99 ng/L); M: middle dose (2´763 ng/L); H: high dose (13´650 ng/L). |