
|
Fig. 2
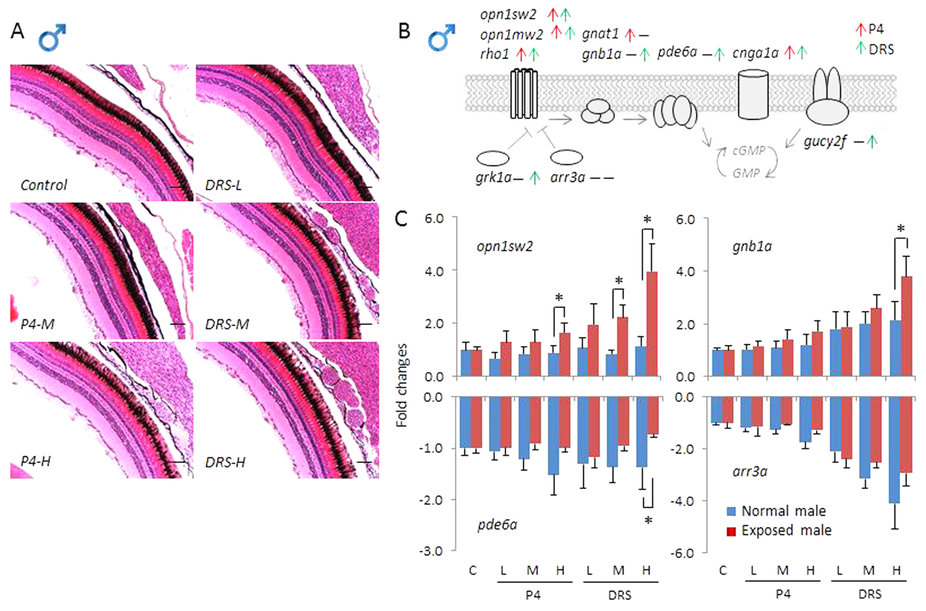
Histology and transcriptional responses of photo-transduction genes in eyes of males.
(A) Transverse sections of eyes of male zebrafish exposed to solvent control, and different concentrations of P4 and DRS. Scale bar = 50 µm. (B) Schematic diagram depicts the photo-transduction cascade in zebrafish and ten key genes measured in the present study. Red arrow: up-regulated genes in response to P4. Green arrow: up-regulated genes in response to DRS. (C) Transcriptional responses of four key genes (opn1sw2, gnb1a, pde6a and arr3a) expressed as fold-changes compared to unexposed (normal) males sampled at the same time-point. Blue bars in each figure represent gene expressions of unexposed (normal) males. Red bars in each figure represent gene expressions of exposed females; Solvent control and P4 and DRS-exposed. Key for concentrations (red bars): P4: L: low dose (7 ng/L); M: middle dose (116 ng/L); H: high dose (742 ng/L). DRS: L: low dose (99 ng/L); M: middle dose (2´763 ng/L); H: high dose (13´650 ng/L).