
- Title
-
A co-culture assay of embryonic zebrafish hearts to assess migration of epicardial cells in vitro
- Authors
- Yue, M.S., Plavicki, J.S., Li, X.Y., Peterson, R.E., Heideman, W.
- Source
- Full text @ BMC Dev. Biol.

Migration of epicardial cells from donor hearts onto control, sih, or tbx5 MO recipient hearts. a-c Fluorescence images taken on Days 1, 3, 5, and 7 in culture show progression of epicardial cell migration. Red (tcf21:DsRed2) shows epicardial cells from the donor, green (cmlc2:EGFP) shows recipient myocardial cells. a Migration of donor epicardial cells onto a control MO recipient heart is apparent by Day 5 in culture. The merged red-on-green signal, appearing yellow, is significantly noticeable by Day 7. There does not appear to be any significant migration of donor epicardial cells onto either the sih MO recipient heart (b) or the tbx5 MO heart (c) throughout the 7 days in culture. d-f Confocal microscopy images of donor/recipient heart samples after 7 days in culture. Red indicates tcf21:DsRed2 donor epicardial cells, green indicates cmlc2:EGFP recipient myocardial cells, blue indicates DNA (DAPI stain). d Confocal microscopy verifies the presence of donor epicardial cells that have migrated onto the control MO recipient myocardium (yellow arrows). In contrast, there does not seem be any donor epicardial cells on the sih MO recipient heart (e) or the tbx5 MO recipient heart (f), which is consistent with the epifluorescence images. In this figure, single hearts were followed throughout the 7-day time course in panels a-c, and were then collected to produce the confocal images shown in panels d-f. Scale bars in all images represent 100 μm |
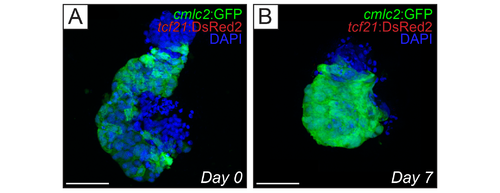
Hearts extracted at 60 hpf lack epicardial cells. (A and B) Confocal micrographs of cmlc2:EGFP; tcf21:DsRed2 hearts extracted at 60 hpf . Images show brightest point projections from confocal z-series. (A) cmlc2:EGFP; tcf21:DsRed2 hearts before being placed into culture (Day 0). (B), cmlc2:EGFP; tcf21:DsRed2 hearts after 7 days in culture (Day 7). There were no epicardial cells (red) observed on the heart myocardia (green) at Day 0 or Day 7. In addition, there were no observed tcf21- cells with the stereotypical flattened phenotype of epicardial cells present on top of the myocardium (blue, DAPI nuclear staining). Scale bars in all images represent 50 μm. |