
- Title
-
A Macrophage Subversion Factor Is Shared by Intracellular and Extracellular Pathogens
- Authors
- Belon, C., Soscia, C., Bernut, A., Laubier, A., Bleves, S., Blanc-Potard, A.B.
- Source
- Full text @ PLoS Pathog.

Infection of zebrafish embryos with the P. aeruginosa mgtC mutant. (A) Diagram of 30 hours post-fertilization (hpf) zebrafish embryo showing the injection site used in this study (arrow). All injections were done in the caudal vein (CV) just behind to the urogenital opening (UGO). Y: Yolk, CHT: Caudal Hematopoietic Tissue. Scale bar, 100 µm. (B) Survival curves of embryos infected with PAO1 wild-type stain or PAO1 ΔmgtC mutant and PBS-injected (control). Approximately 1200–1400 CFU P. aeruginosa were microinjected into the caudal vein (n = 20 per group). Results are expressed as the percentage of surviving on each hour post-infection. Representative results of three biologically independent replicates are shown. Embryos are significantly more susceptible to infection with PAO1 wild-type than ΔmgtC mutant (P<0.001). (C) 30 hpf embryons are intravenously infected with PAO1 or ΔmgtC mutant expressing mCherry. Representative fluorescence microscopy images of 18 hpi embryos infected with PAO1 (top panel) or PAO1 ΔmgtC mutant (bottow panel) are shown (1200–1400 CFU). Scale bar, 200 µm. (D) 30 hpf zebrafish embryos are intravenously infected with mCherry-expressing PAO1 (left panel) or PAO1 ΔmgtC mutant (right panel) and imaged by confocal microscopy. Arrows indicate maximum intensity projection of macrophages that phagocytose bacteria close to the site of injection at 1 hpi. Scale bar, 10 µm. (E) Survival curves of pu.1 morphant (pu.1 mo) embryos (n = 20 each) infected with 900 CFU of PAO1 wild type stain or PAO1 ΔmgtC mutant compared to the PBS- injected control. Representative results of three biologically independent replicates are shown. No statistically significant difference is obtained between wild type-infected embryos and ΔmgtC mutant-infected embryos (ns: non significant). |
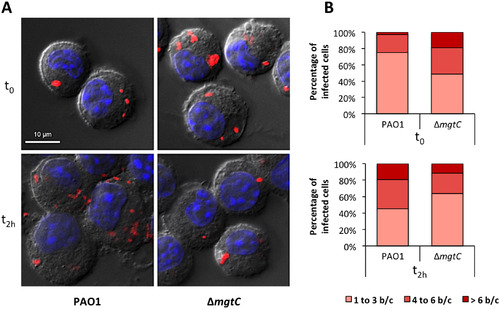
Visualisation and quantification of intracellular bacteria in fixed macrophages. Macrophages infected with PAO1 or ΔmgtC mutant expressing mCherry were fixed after phagocytosis and 20 min (t0) or 2 hours (t2h) treatment with amikacin. (A) Visualization of intracellular bacteria. The images shown were obtained by making a maximum projection of 12 central planes from a Z-stack. The merged image shows Differential Interference Contrast (DIC), nucleus staining (blue) and bacteria expressing mCherry (red). (B) Count of the number of bacteria in infected macrophages from images obtained with the maximum projection. The numbers of bacteria per cell (b/c) were classified in three groups and percentage of each class is shown. Count is done from at least 20 cells and results are expressed as means from three independent experiments. |