
- Title
-
Development of a convenient in vivo hepatotoxin assay using a transgenic zebrafish line with liver-specific DsRed expression
- Authors
- Zhang, X., Li, C., Gong, Z.
- Source
- Full text @ PLoS One
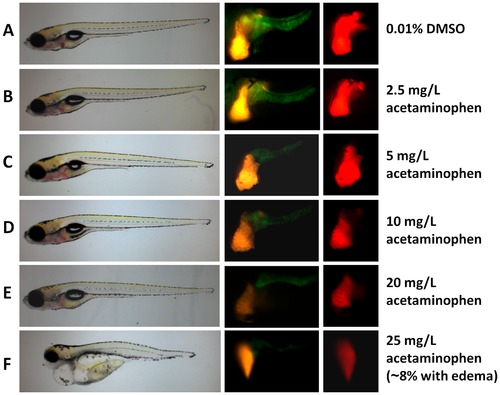
General phenotype and RFP and GFP expression in LiPan fry treated with example hepatotoxin acetaminophen. Representative fry from each treatment group with different concentrations are shown. (A) Vehicle control group with 0.01% DMSO. (B-F) Acetaminophen treatment groups with increasing concentrations of acetaminophen as indicated on the right. The left row represents general phenotype, the middle row shows liver-specific RFP and exocrine pancreas-specific GFP expression through a GFP filter (470 nm wave length), and the right row is liver-specific RFP expression through an RFP filter (546 nm wave length). Note that edema in (F) was observed only in less than 8% of 25 mg/L acetaminophen-treated fry. |
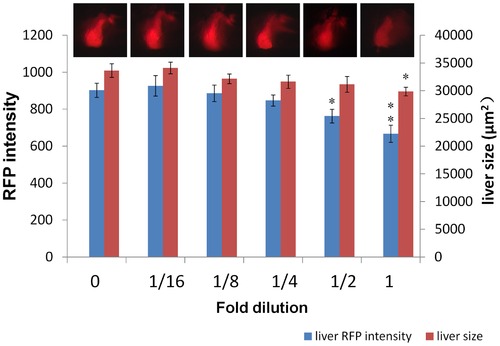
Combined hepatotoxin effect. LiPan fry were treated with a mixture of four hepatotoxins with increasing dilution factors. "1" indicates undiluted mixture with the following final concentrations in the treatment: 2.5 mg/L acetaminophen, 1 mg/L aspirin, 1 mg/L isoniazid and 0.1 mg/L phenylbutazone. "0" represents vehicle control groups with 0.01% DMSO. All other groups are dilutions from ½ to 1/16. Blue bars indicate liver RFP intensity and red bars refer liver size. Representative liver-specific RFP expression is shown at top of each group. Asterisks indicate statistical significance: *, P<0.05; **. P<0.01. |
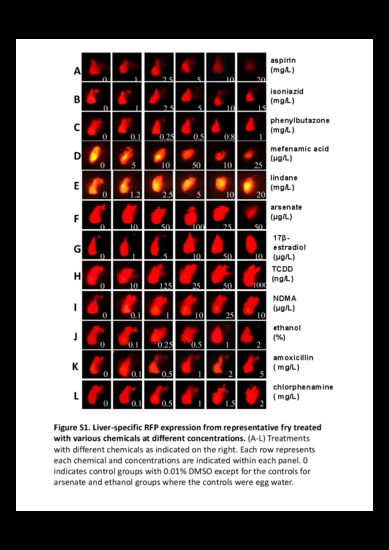
Liver-specific RFP expression from representative fry treated with various chemicals at different concentrations. (A-L) Treatments with different chemicals as indicated on the right. Each row represents each chemical and concentrations are indicated within each panel. 0 indicates control groups with 0.01% DMSO except for the controls for arsenate and ethanol groups where the controls were egg water. |
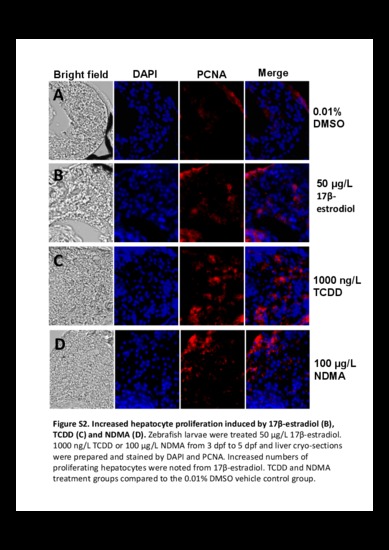
Increased hepatocyte proliferation induced by 17β-estradiol (B), TCDD (C) and NDMA (D). Zebrafish larvae were treated 50 µg/L 17β-estradiol. 1000 ng/L TCDD or 100 μg/L NDMA from 3 dpf to 5 dpf and liver cryo-sections were prepared and stained by DAPI and PCNA. Increased numbers of proliferating hepatocytes were noted from 17β-estradiol. TCDD and NDMA treatment groups compared to the 0.01% DMSO vehicle control group. |