
|
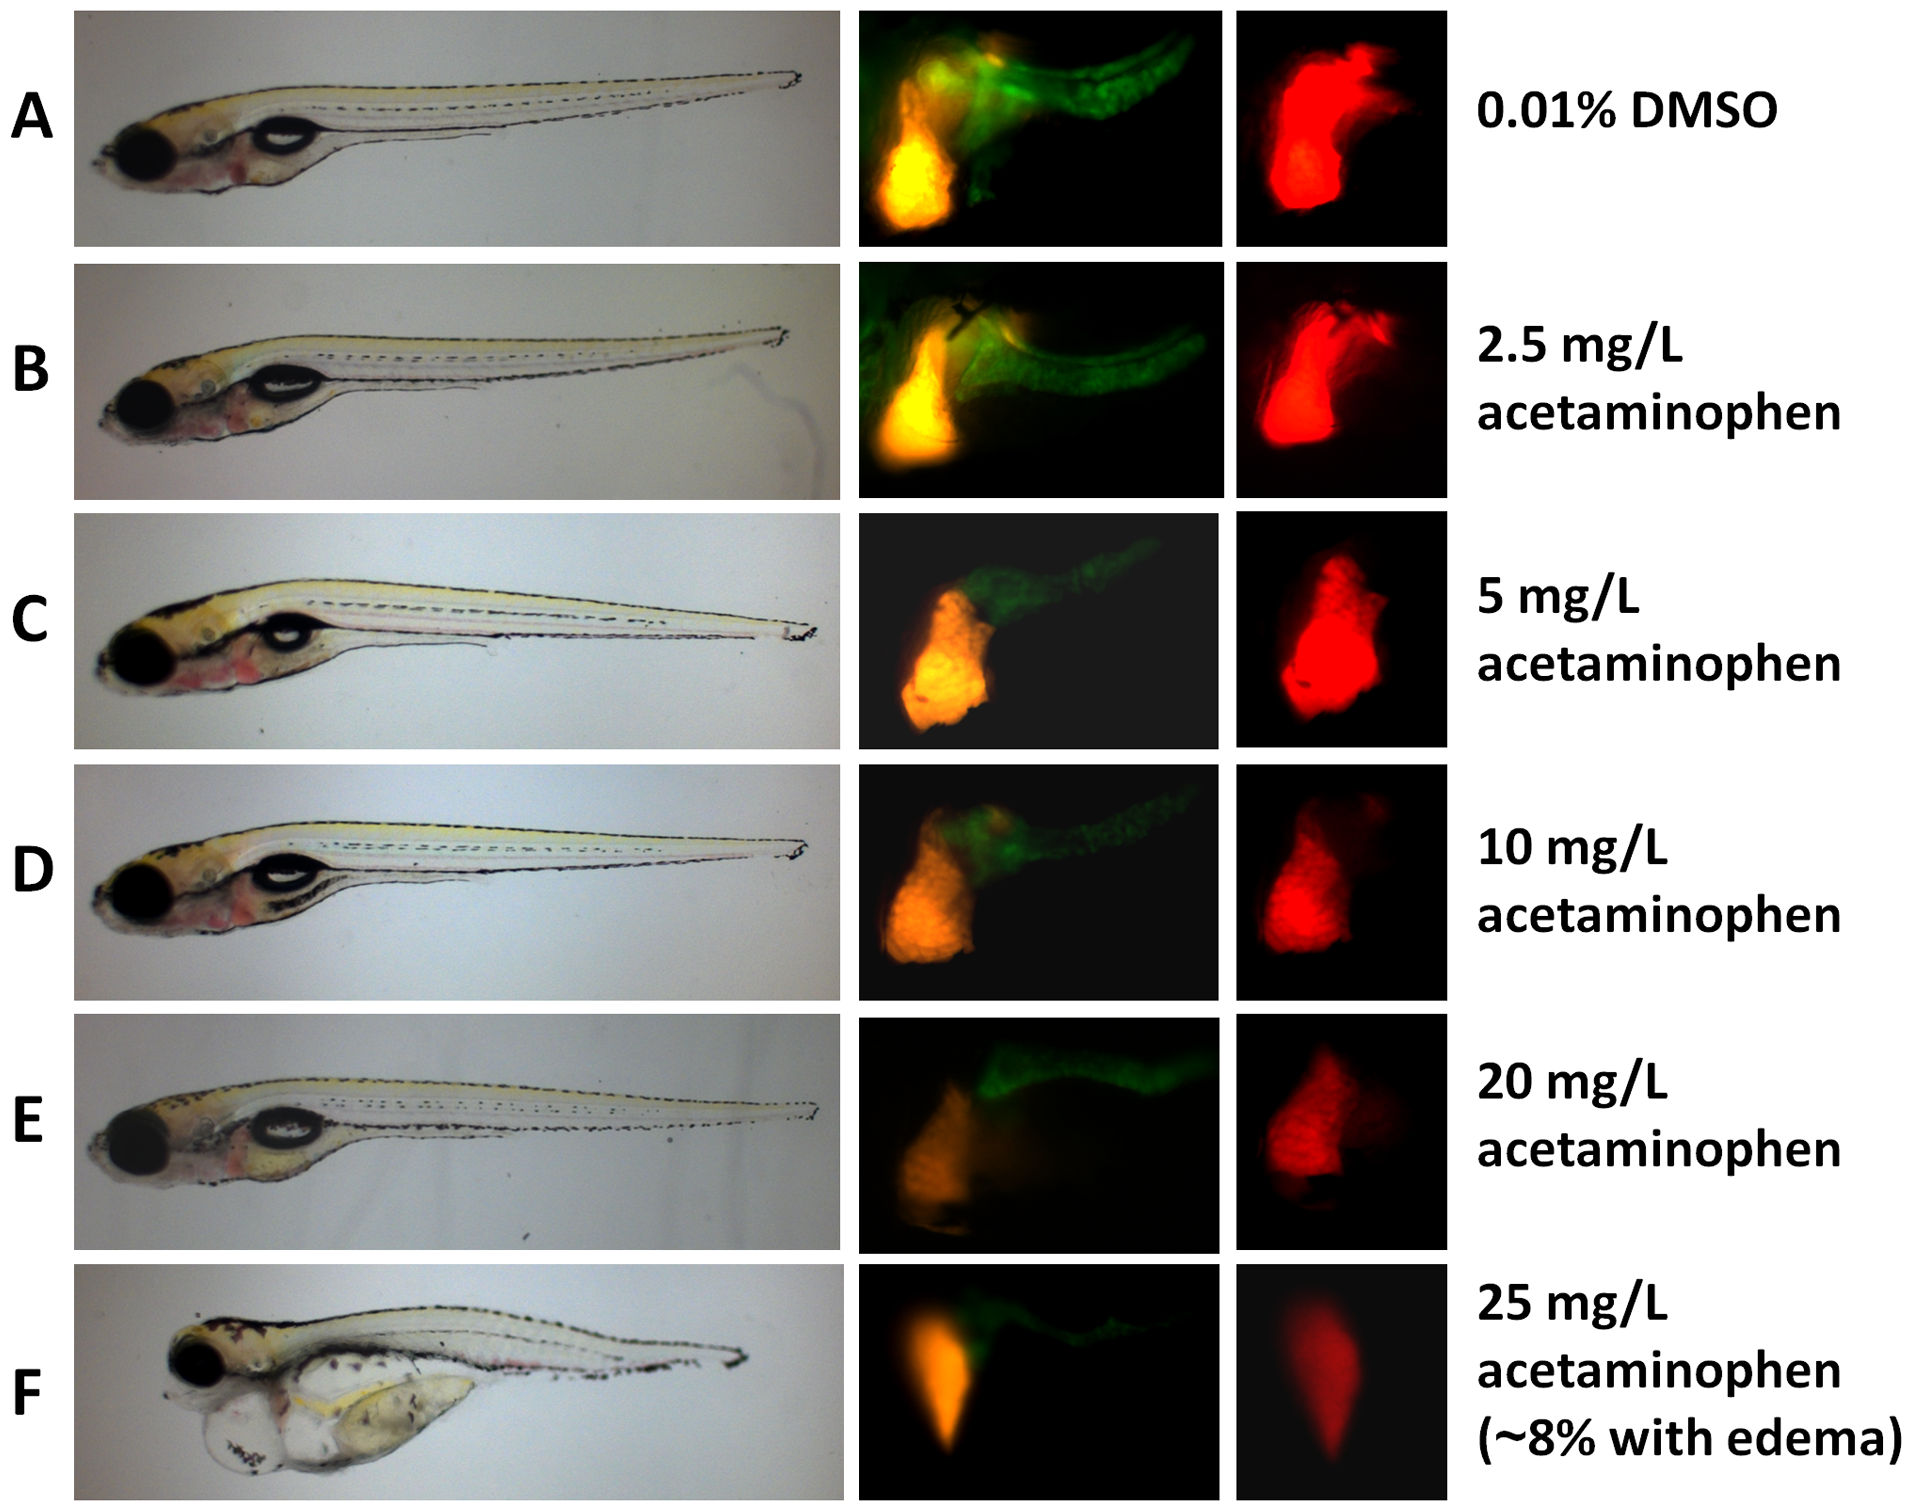
Fig. 1
General phenotype and RFP and GFP expression in LiPan fry treated with example hepatotoxin acetaminophen.
Representative fry from each treatment group with different concentrations are shown. (A) Vehicle control group with 0.01% DMSO. (B-F) Acetaminophen treatment groups with increasing concentrations of acetaminophen as indicated on the right. The left row represents general phenotype, the middle row shows liver-specific RFP and exocrine pancreas-specific GFP expression through a GFP filter (470 nm wave length), and the right row is liver-specific RFP expression through an RFP filter (546 nm wave length). Note that edema in (F) was observed only in less than 8% of 25 mg/L acetaminophen-treated fry.